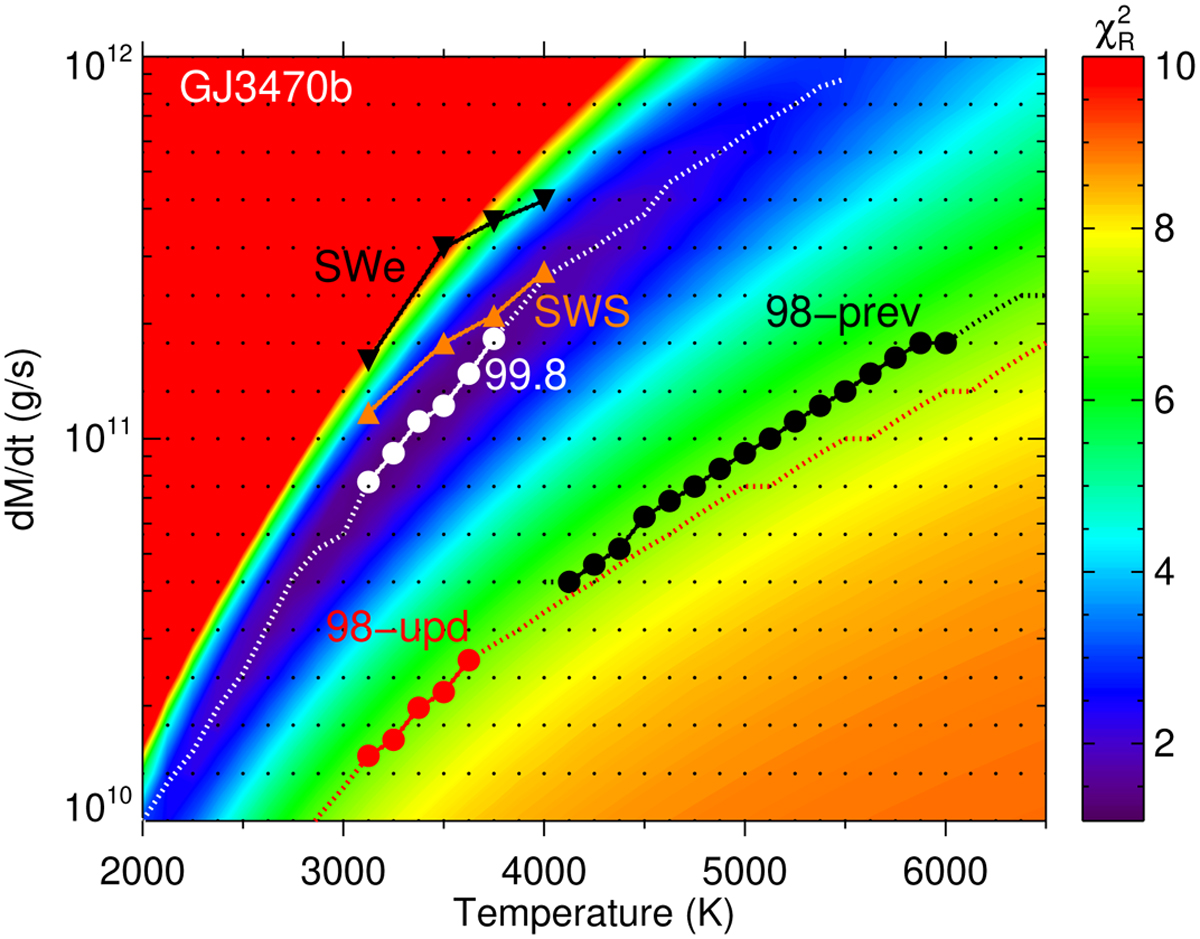
Fig. 10
Download original image
Contour maps of the reduced χ2 for He(23S) absorption of GJ 3470 b. Dotted curves represent the best fits, with large circles denoting the constrained ranges for a confidence level of 95%. Overplotted are also the curve and symbols for H/He = 98/2 obtained previously by Lampón et al. (2021b), black solid circles, where the label ‘98’ corresponds to the hydrogen percentage. The curves and triangles are the Ṁ–T ranges obtained for H/He = 99.8 when including the effects of SW (see Sect. 3.2) for a fast solar wind (upward triangles, orange) and a scaled stellar wind (downward triangles, black). The black dots represent the grid of the simulations.
Current usage metrics show cumulative count of Article Views (full-text article views including HTML views, PDF and ePub downloads, according to the available data) and Abstracts Views on Vision4Press platform.
Data correspond to usage on the plateform after 2015. The current usage metrics is available 48-96 hours after online publication and is updated daily on week days.
Initial download of the metrics may take a while.