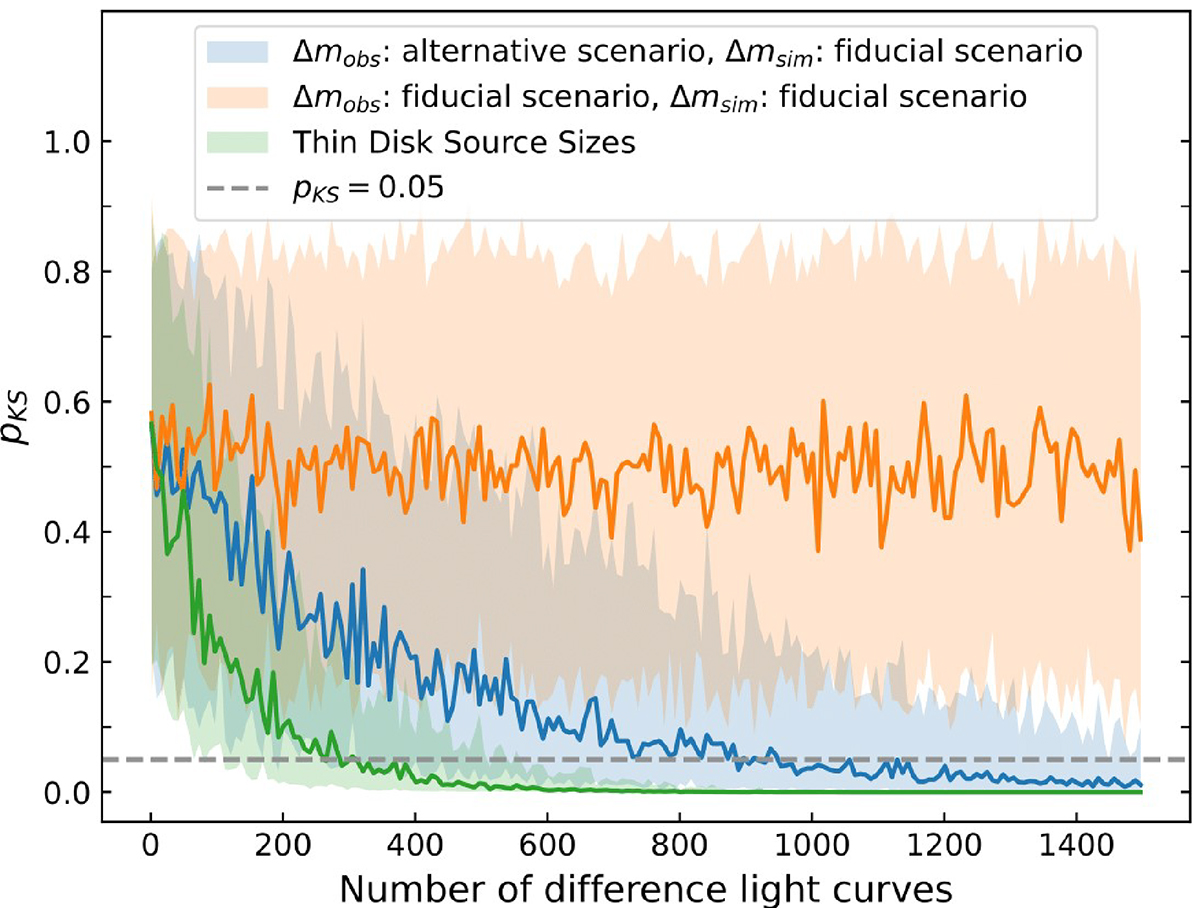
Fig. 6.
Download original image
p-value from the KS test pKS against number of microlensing light curves. The solid line indicate the median of pKS distribution with the shade region bounded between the 84th and the 16th percentiles. The fiducial scenario adopts the conventional stellar distribution as microlenses, while the alternative scenario assumes that all the mass in the galaxy is in the form of compact objects, namely, κ*/κ = 1 (see Fig. 5). Given that Δmobs and Δmsim come from the same distribution, pKS is expected to be 0.5 on average (orange line), regardless of the number of light curves used for this experiment. When Δmobs and Δmsim come from different distributions, the median value of pKS decreases steadily with the sample size, enabling us to distinguish between two scenarios. The horizontal dashed line marks α = 0.05, corresponding to the threshold where the null hypothesis H0 is rejected with a confidence level of 95%. The blue and green lines represent our results when using disk sizes from continuum reverberation mapping and from the thin disk model, respectively.
Current usage metrics show cumulative count of Article Views (full-text article views including HTML views, PDF and ePub downloads, according to the available data) and Abstracts Views on Vision4Press platform.
Data correspond to usage on the plateform after 2015. The current usage metrics is available 48-96 hours after online publication and is updated daily on week days.
Initial download of the metrics may take a while.