Fig. 4.
Download original image
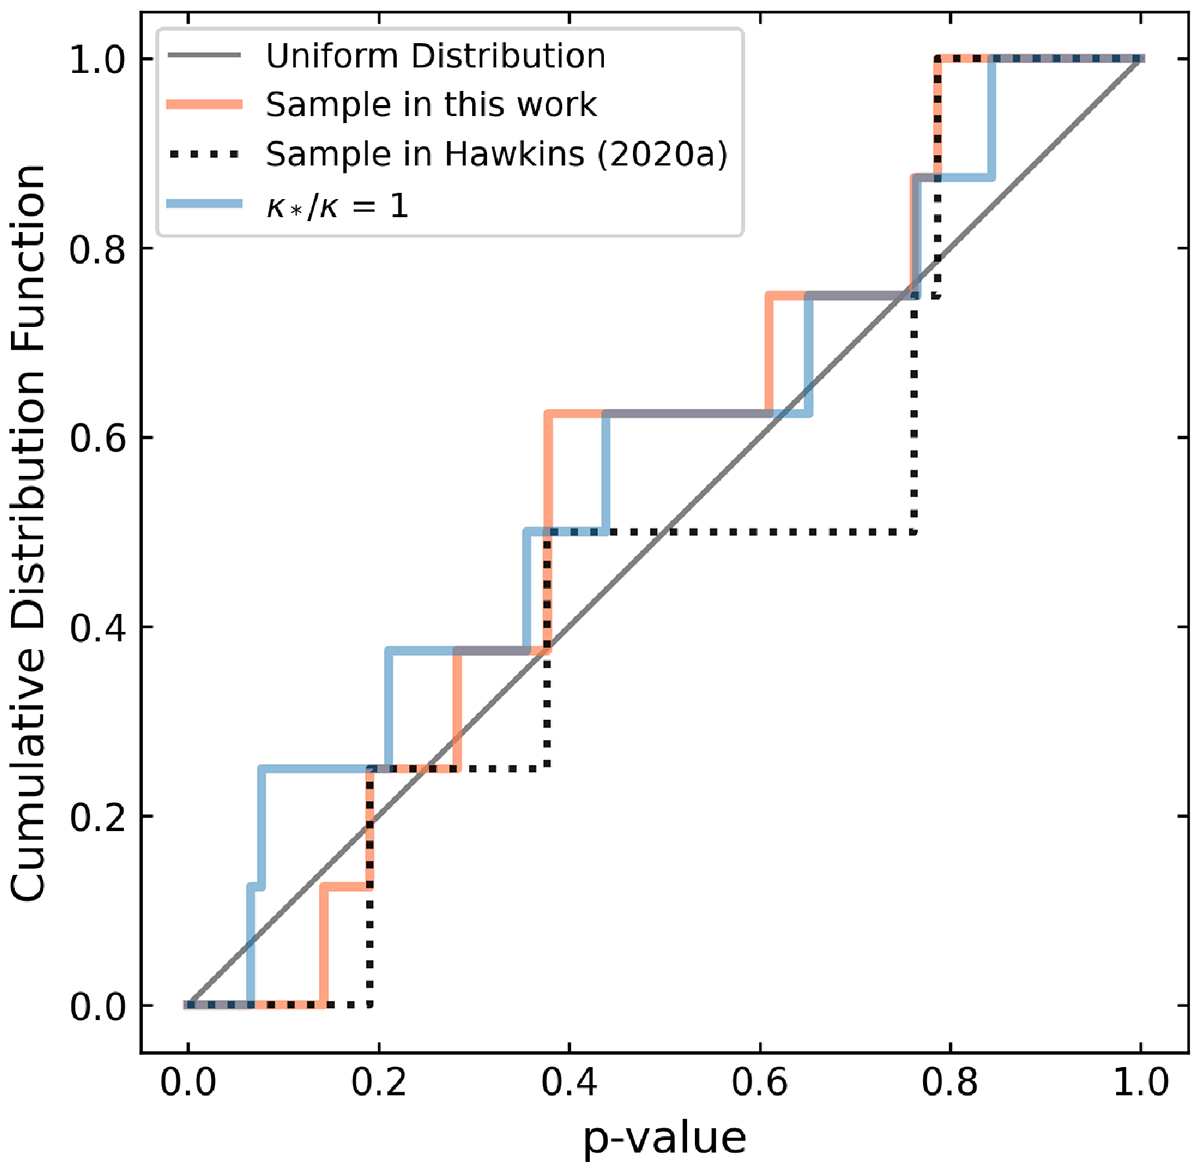
Cumulative distribution functions (CDF) of the p-values. The CDF of a uniform distribution represented by the solid grey line is what is expected when the hypothesis is true. Three tests represented by the dotted black, solid blue, and orange lines produce pKS > 0.05, showing that the hypotheses of microlenses composed of compact objects only and of stars+smooth DM cannot be rejected due to the small sample size.
Current usage metrics show cumulative count of Article Views (full-text article views including HTML views, PDF and ePub downloads, according to the available data) and Abstracts Views on Vision4Press platform.
Data correspond to usage on the plateform after 2015. The current usage metrics is available 48-96 hours after online publication and is updated daily on week days.
Initial download of the metrics may take a while.