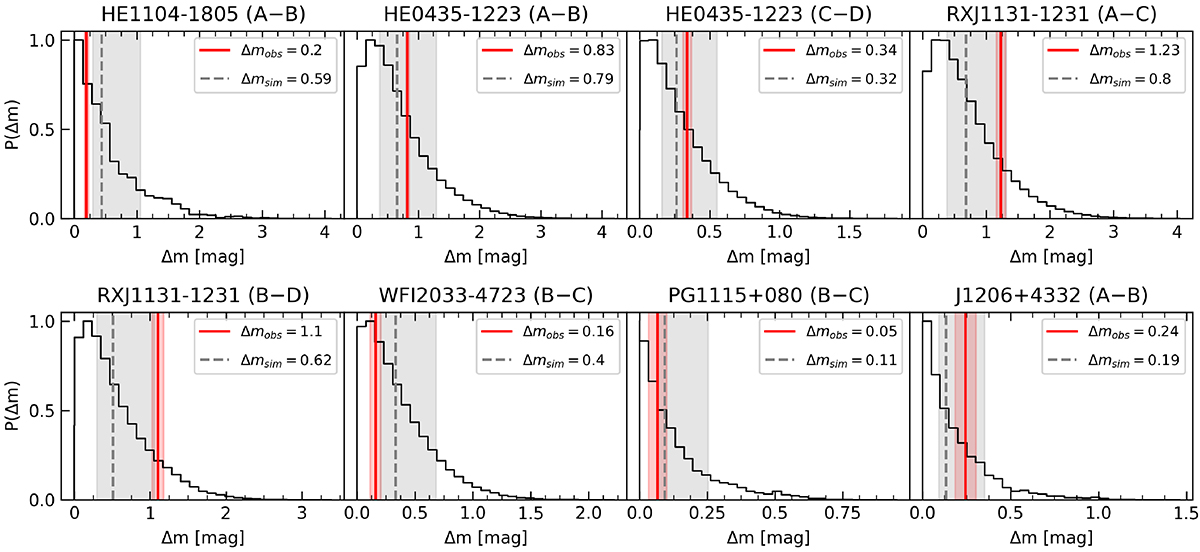
Fig. 3.
Download original image
Probability distributions of magnification amplitude, Δm. The black histogram is generated from Δmsim in the simulated light curves, with the median (dashed line), along with the 84th and 16th percentile indicated as grey shaded areas. The red vertical lines, Δmobs, are measured in the observed light curves and given in Table 2. We also display the quadratic sum of the photometric uncertainties as a red shaded line.
Current usage metrics show cumulative count of Article Views (full-text article views including HTML views, PDF and ePub downloads, according to the available data) and Abstracts Views on Vision4Press platform.
Data correspond to usage on the plateform after 2015. The current usage metrics is available 48-96 hours after online publication and is updated daily on week days.
Initial download of the metrics may take a while.