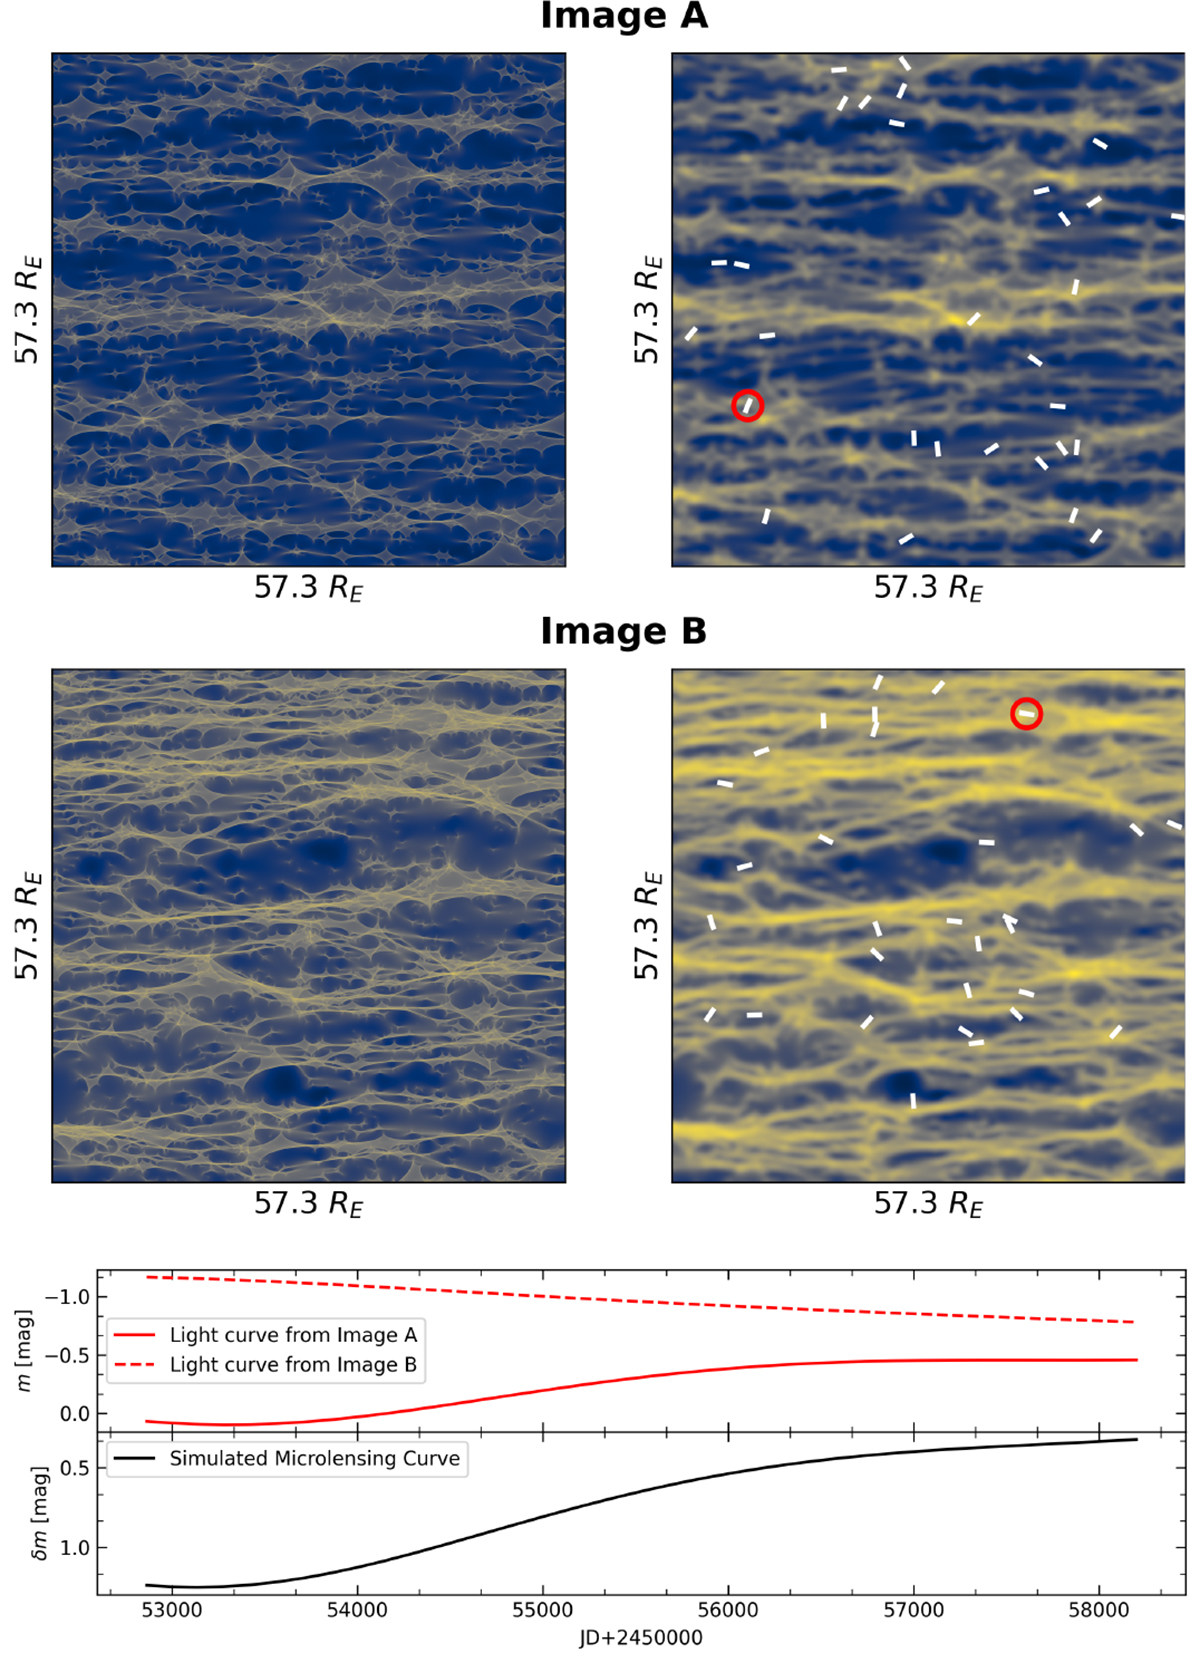
Fig. 2.
Download original image
Microlensing simulation for HE 0435−1223. Magnification maps of images A (top left) and B (middle left) are generated using microlenses with ⟨M*⟩ = 0.2 following the Salpeter initial mass function within the mass range of 0.06 M⊙ and 6.46 M⊙. The convolved maps of images A (top right) and B (middle right) are obtained with a Gaussian kernel for the source half-light radius as listed in Table 1. Each map has 57.3 × RE on a side (or 2000 pixels). A few trajectories (white lines) are randomly drawn with a transverse velocity of 600 km s−1 and a length equal to the observational duration (5338 days). A pair of simulated light curves (red circles) is shown on the bottom panel. The corresponding difference light curve δm yields the microlensing amplitude Δm ≈ 0.75 mag, following our definition in Sect. 3.
Current usage metrics show cumulative count of Article Views (full-text article views including HTML views, PDF and ePub downloads, according to the available data) and Abstracts Views on Vision4Press platform.
Data correspond to usage on the plateform after 2015. The current usage metrics is available 48-96 hours after online publication and is updated daily on week days.
Initial download of the metrics may take a while.