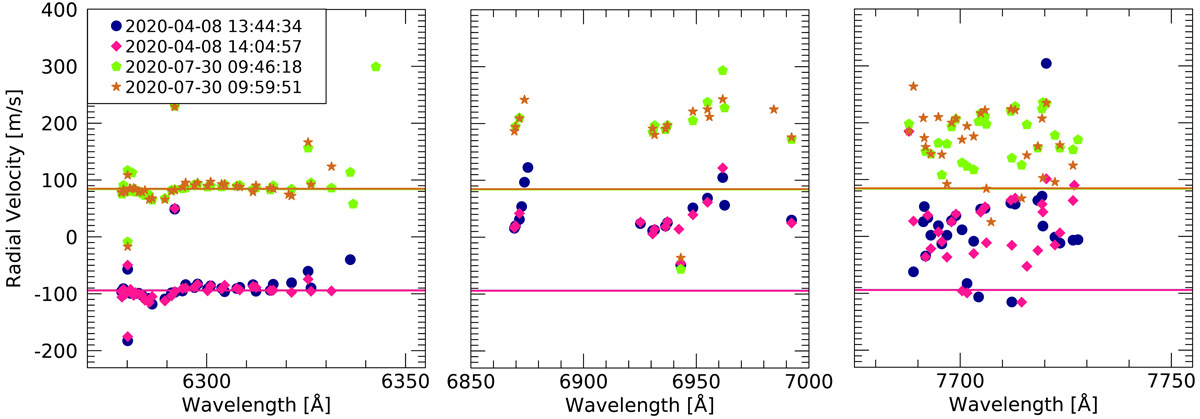
Fig. 5.
Download original image
Calculated radial velocities, v = Δν/ν0 ⋅ c, of line shifts between about 100 observed telluric lines and the reference wavelength of the HITRAN2020 line list. The panels show v values for three different wavelength ranges (vacuum wavelength) and four spectra of two different months. The horizontal lines mark the respective median of the velocities of the first panel.
Current usage metrics show cumulative count of Article Views (full-text article views including HTML views, PDF and ePub downloads, according to the available data) and Abstracts Views on Vision4Press platform.
Data correspond to usage on the plateform after 2015. The current usage metrics is available 48-96 hours after online publication and is updated daily on week days.
Initial download of the metrics may take a while.