Open Access
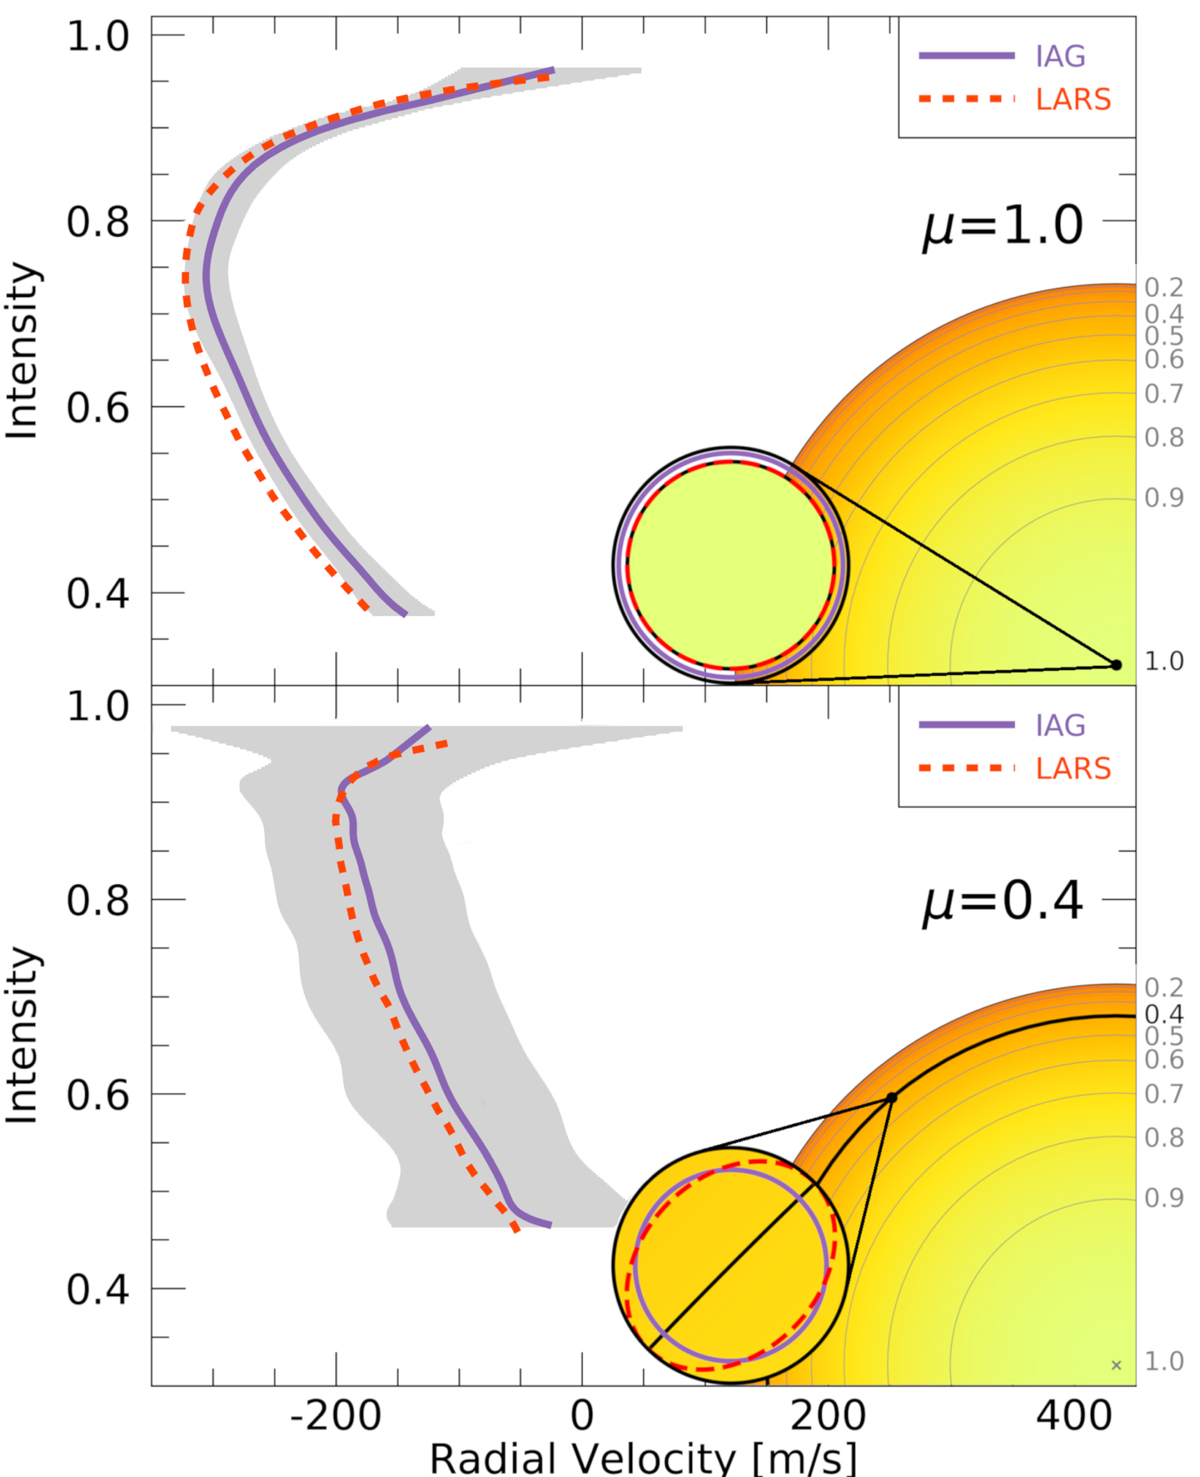
Fig. 12.
Download original image
Bisectors of μ = 1.0 and μ = 0.4 for the 6175 Å line with the corresponding observation area. The grey area marks the standard deviation of the IAG data. The purple circle marks the size of the IAG fibre with 32.5″, while the red areas mark the LARS observations.
Current usage metrics show cumulative count of Article Views (full-text article views including HTML views, PDF and ePub downloads, according to the available data) and Abstracts Views on Vision4Press platform.
Data correspond to usage on the plateform after 2015. The current usage metrics is available 48-96 hours after online publication and is updated daily on week days.
Initial download of the metrics may take a while.