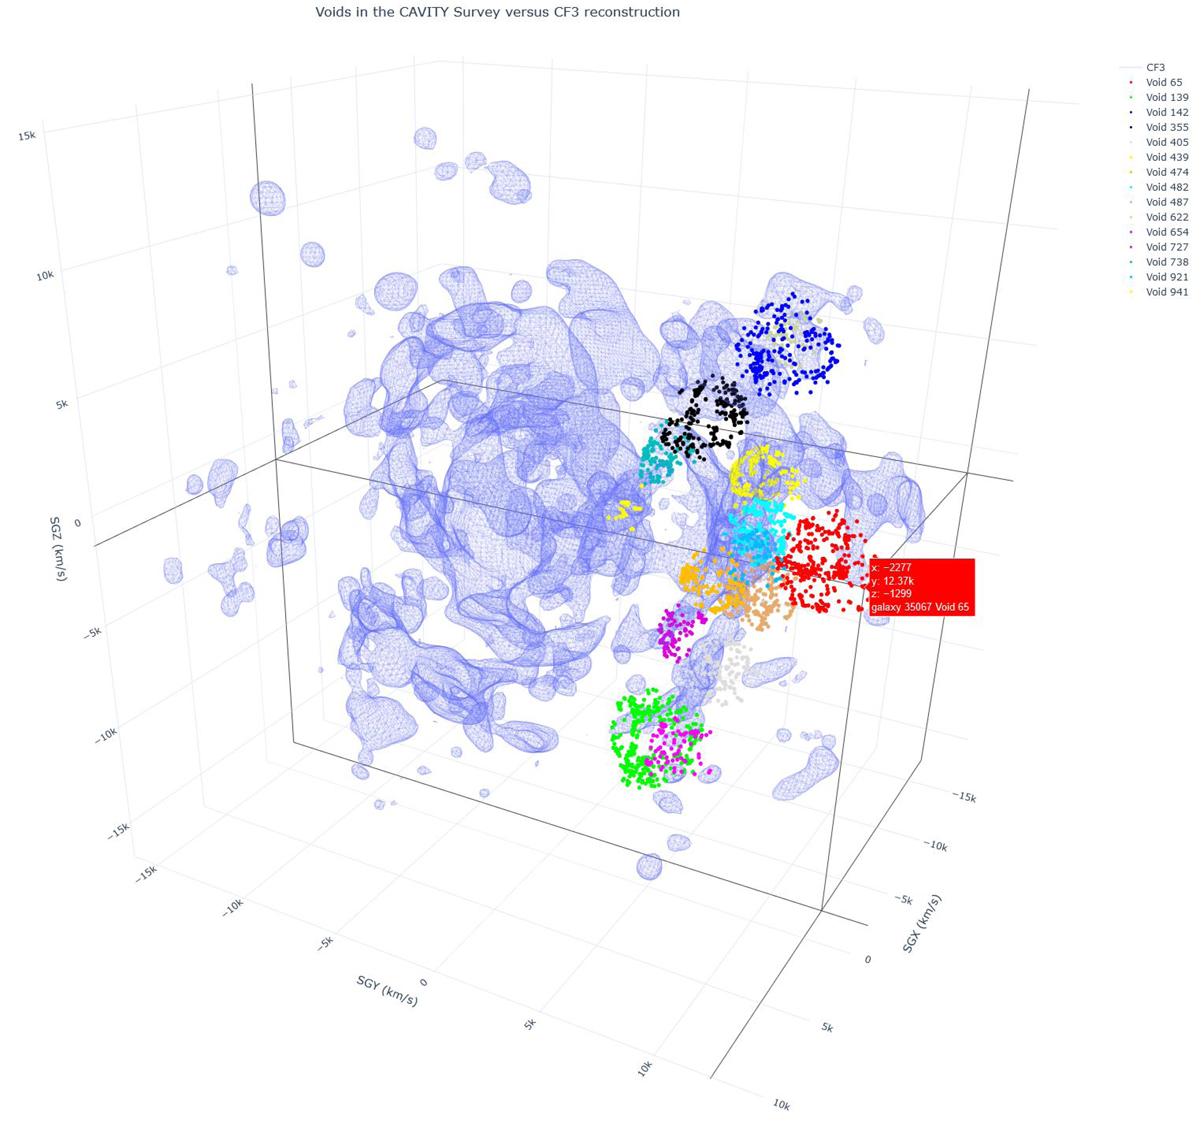
Fig. 1.
Download original image
Interactive 3D visualization of the distribution of nearby voids (use interactivity at https://irfu.cea.fr/Projets/COAST/cavity-CF3.html). The positions of the CAVITY survey target galaxies are given by markers colored according to their void membership as indicated in the column displayed on the right-hand side. In the online version, hovering over the galaxy markers reveals the galaxy positions, identifiers, and void memberships. The wireframe polygon is a high-density (δm = 1.3) isosurface of the reconstructed CosmicFlows-3 overdensity field. Also in the interactive version, the user can rotate, pan, and zoom in and out using the mouse. Single-click or double-click on the elements listed on the right-hand side column hides them or singles them out from the scene.
Current usage metrics show cumulative count of Article Views (full-text article views including HTML views, PDF and ePub downloads, according to the available data) and Abstracts Views on Vision4Press platform.
Data correspond to usage on the plateform after 2015. The current usage metrics is available 48-96 hours after online publication and is updated daily on week days.
Initial download of the metrics may take a while.