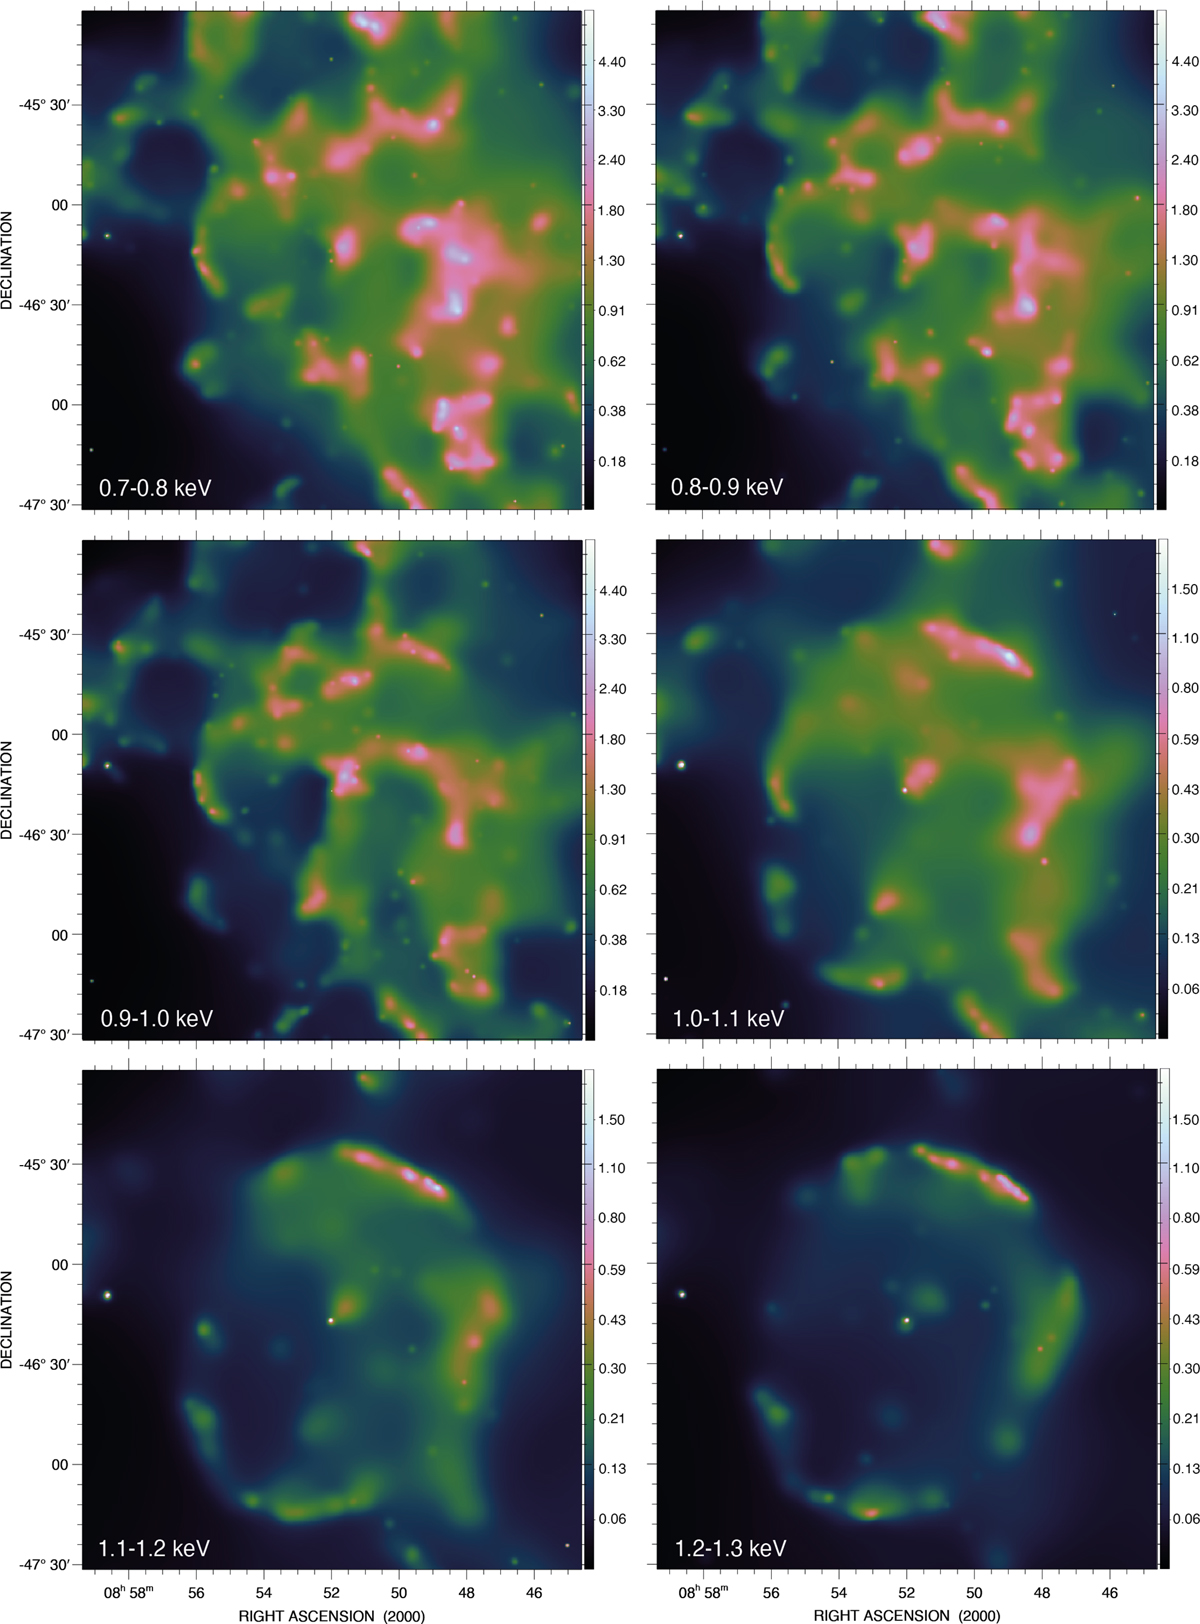
Fig. 3
Download original image
Energy-selected eROSITA (TM1-TM7) view of the Vela Jr region. The images are centered on the position of the CCO. Intensity vs. color are distributed according to the ASINH-function. The color vs. cts pixel−1 distribution in each image is depicted. For the 0.7–1.0 keV images a scale of 0–6 cts pixel−1, and for the 1.1–1.3 keV images a scale of 0–2 cts pixel−1 were used. Below ~ 1 keV emission from the Vela SNR dominates. Above ~ 1 keV the nonthermal emission from Vela Jr starts to stand out above the emission from Vela SNR.
Current usage metrics show cumulative count of Article Views (full-text article views including HTML views, PDF and ePub downloads, according to the available data) and Abstracts Views on Vision4Press platform.
Data correspond to usage on the plateform after 2015. The current usage metrics is available 48-96 hours after online publication and is updated daily on week days.
Initial download of the metrics may take a while.