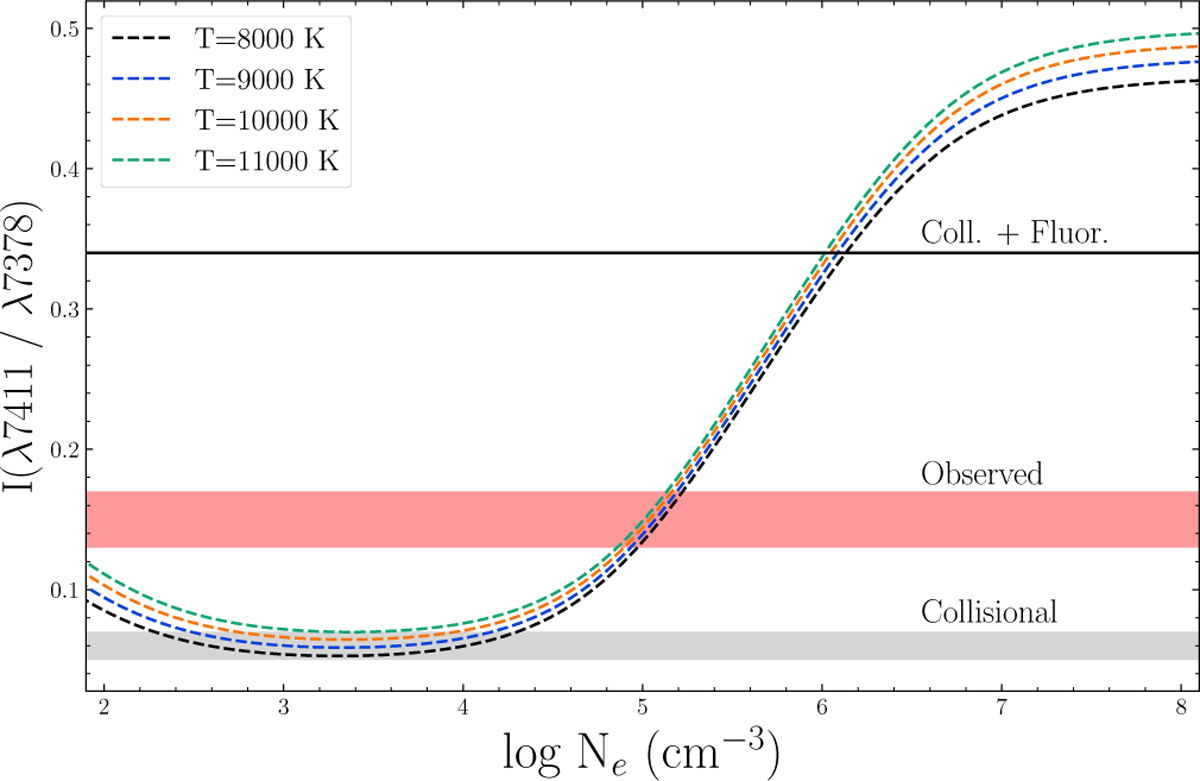
Fig. 8

Download original image
Emissivity ratio of the optically forbidden Ni emission line, calculated in PyNeb. The dashed curves are the emissivity ratios calculated for each given temperature. The gray region denotes the predicted range of ratios for collisional excitation. The red region denotes the range of values we observe in our data. The solid black line denotes the predicted ratio for collisional+fluorescent excitation. The predicted values are taken from Giannini et al. (2015) assuming Te = 10 000 Κ and ne ~ 103–105 cm−3.
Current usage metrics show cumulative count of Article Views (full-text article views including HTML views, PDF and ePub downloads, according to the available data) and Abstracts Views on Vision4Press platform.
Data correspond to usage on the plateform after 2015. The current usage metrics is available 48-96 hours after online publication and is updated daily on week days.
Initial download of the metrics may take a while.


