Fig. 7.
Download original image
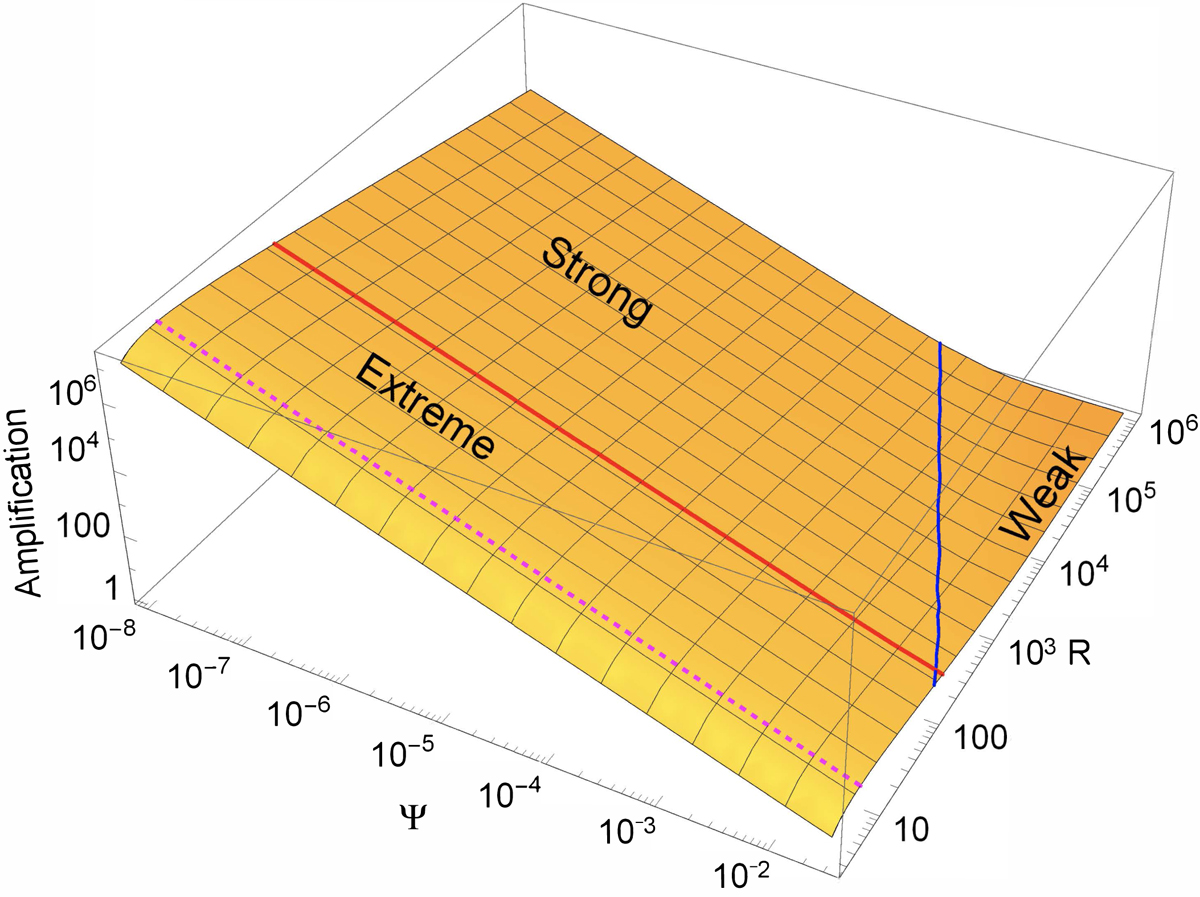
Primary amplification peak of a static source. The bolometric amplification of the first direct image, ℳa+, is shown as a 3D function of the source distance, R, and the angular separation ψ. Different lensing regimes are indicated. The magenta dashed line denotes the source distance of the maximal amplification at fixed ψ, Rmax. The red line at Re = 200M separates the region of extreme gravitational lensing regime and the region of WDL validity. The blue line denotes the source distance, Rws(ψ), separating the region of the strong lensing regime (![]() ) and the region of the weak lensing regime (
) and the region of the weak lensing regime (![]() ). This boundary between the two regimes corresponds to the constant value of the bolometric amplification, ℳa+ = 1.17047, for ψ ≤ 10−2.
). This boundary between the two regimes corresponds to the constant value of the bolometric amplification, ℳa+ = 1.17047, for ψ ≤ 10−2.
Current usage metrics show cumulative count of Article Views (full-text article views including HTML views, PDF and ePub downloads, according to the available data) and Abstracts Views on Vision4Press platform.
Data correspond to usage on the plateform after 2015. The current usage metrics is available 48-96 hours after online publication and is updated daily on week days.
Initial download of the metrics may take a while.