Open Access
Fig. 6.
Download original image
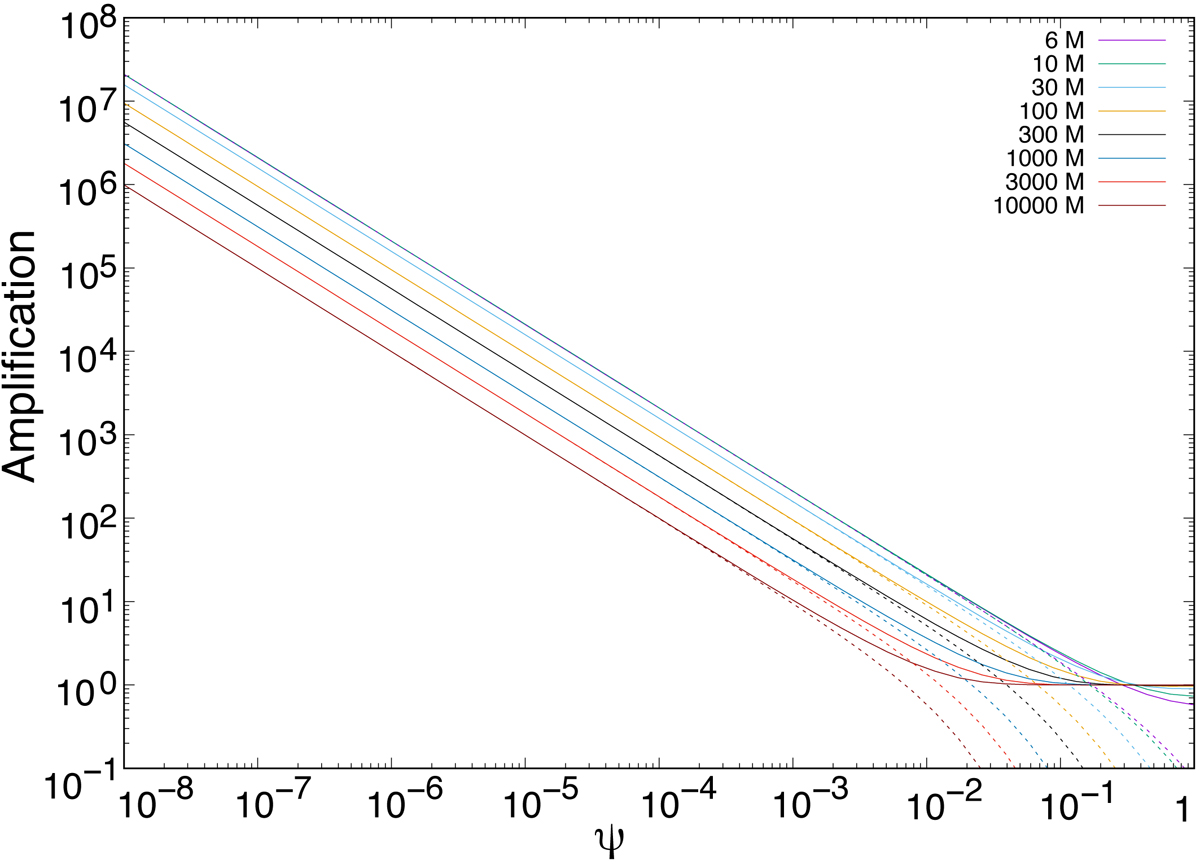
Primary amplification peak of a static source. The bolometric amplification of the first two images of a source at different distances R is shown as a function of angular separation ψ. The solid lines refer to the first direct image, and the dashed lines to the first indirect image.
Current usage metrics show cumulative count of Article Views (full-text article views including HTML views, PDF and ePub downloads, according to the available data) and Abstracts Views on Vision4Press platform.
Data correspond to usage on the plateform after 2015. The current usage metrics is available 48-96 hours after online publication and is updated daily on week days.
Initial download of the metrics may take a while.