Fig. 5.
Download original image
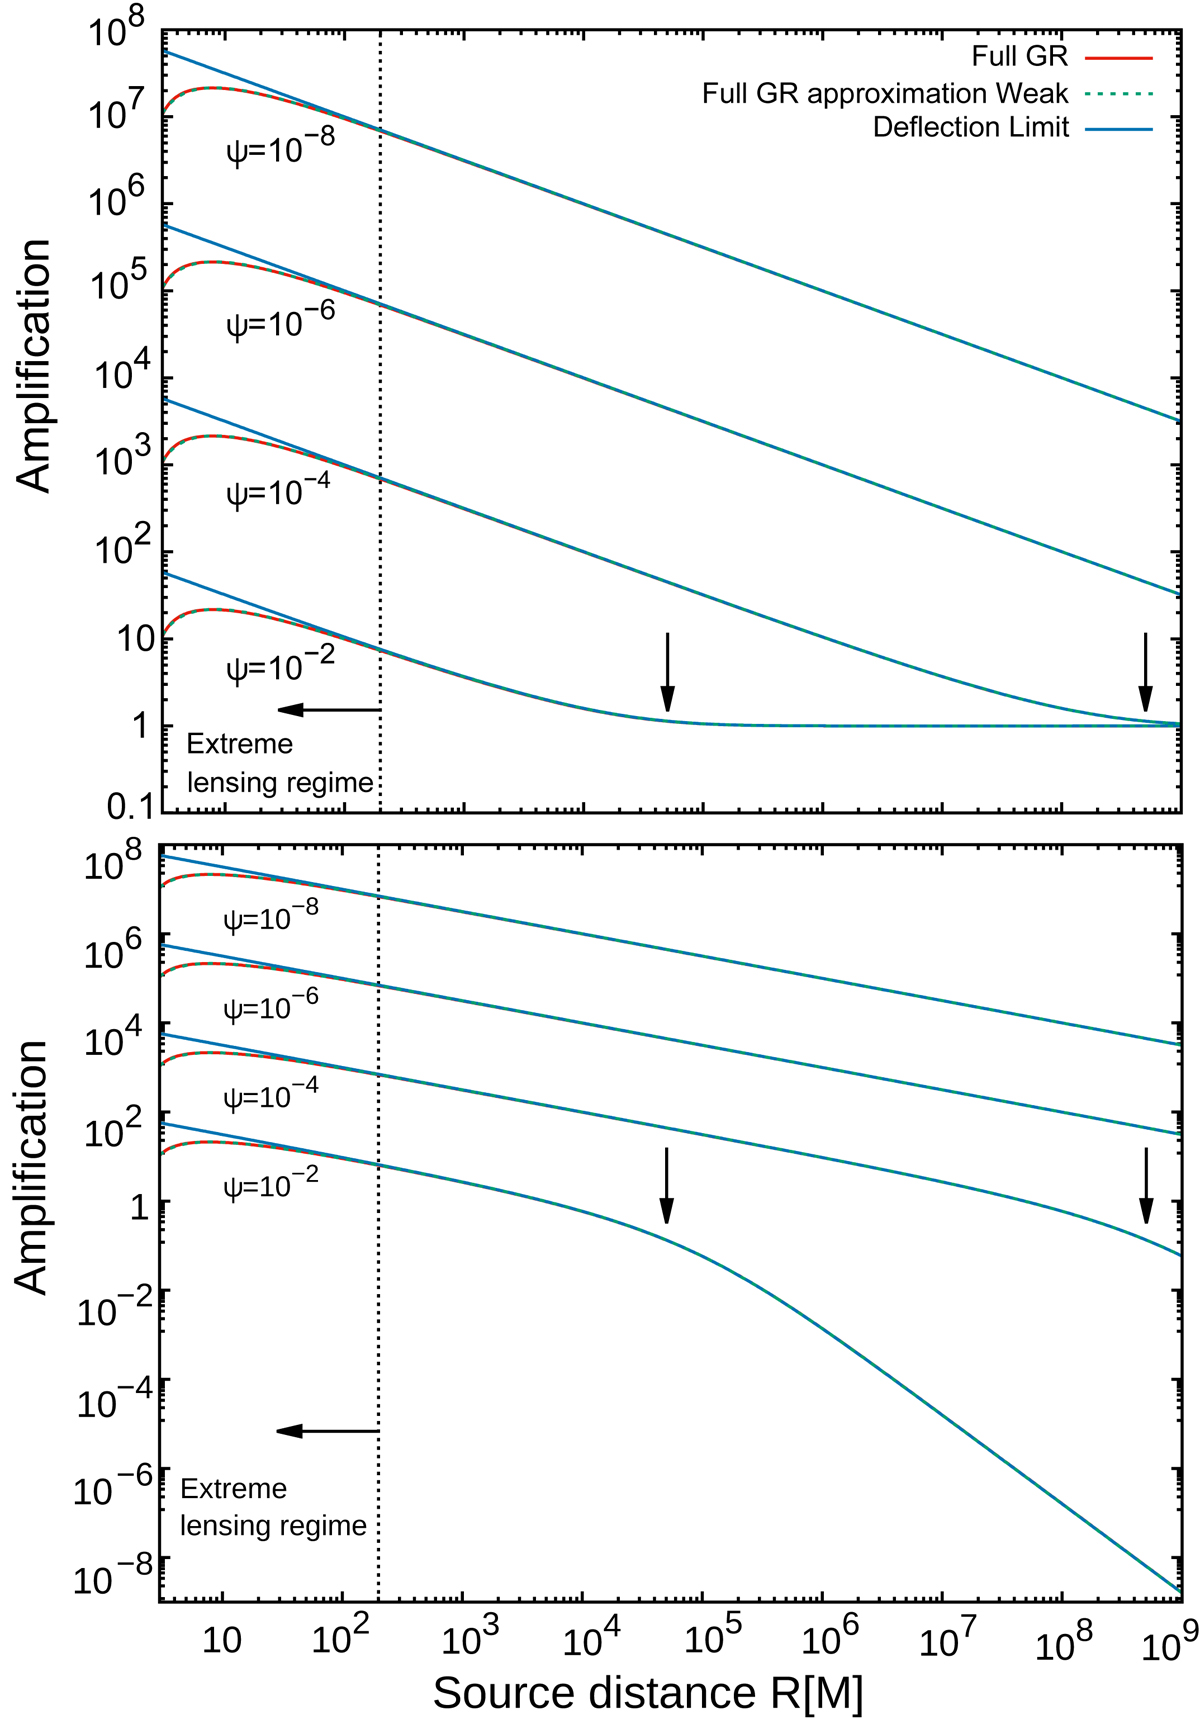
Primary amplification peak of a static source. FGR bolometric amplification compared with the WDL approximation and the FGR approximation. The vertical dashed line at Re = 200M divides the extreme lensing region where an FGR approach must be used from the region, where WDL approximation works. The vertical arrows denote Rws(ψ), the radius of transitions from the strong lensing regime to the weak lensing regime for angular separations ψ = 10−2 and ψ = 10−4. Top: first direct image. Bottom: first indirect image.
Current usage metrics show cumulative count of Article Views (full-text article views including HTML views, PDF and ePub downloads, according to the available data) and Abstracts Views on Vision4Press platform.
Data correspond to usage on the plateform after 2015. The current usage metrics is available 48-96 hours after online publication and is updated daily on week days.
Initial download of the metrics may take a while.