Fig. 18.
Download original image
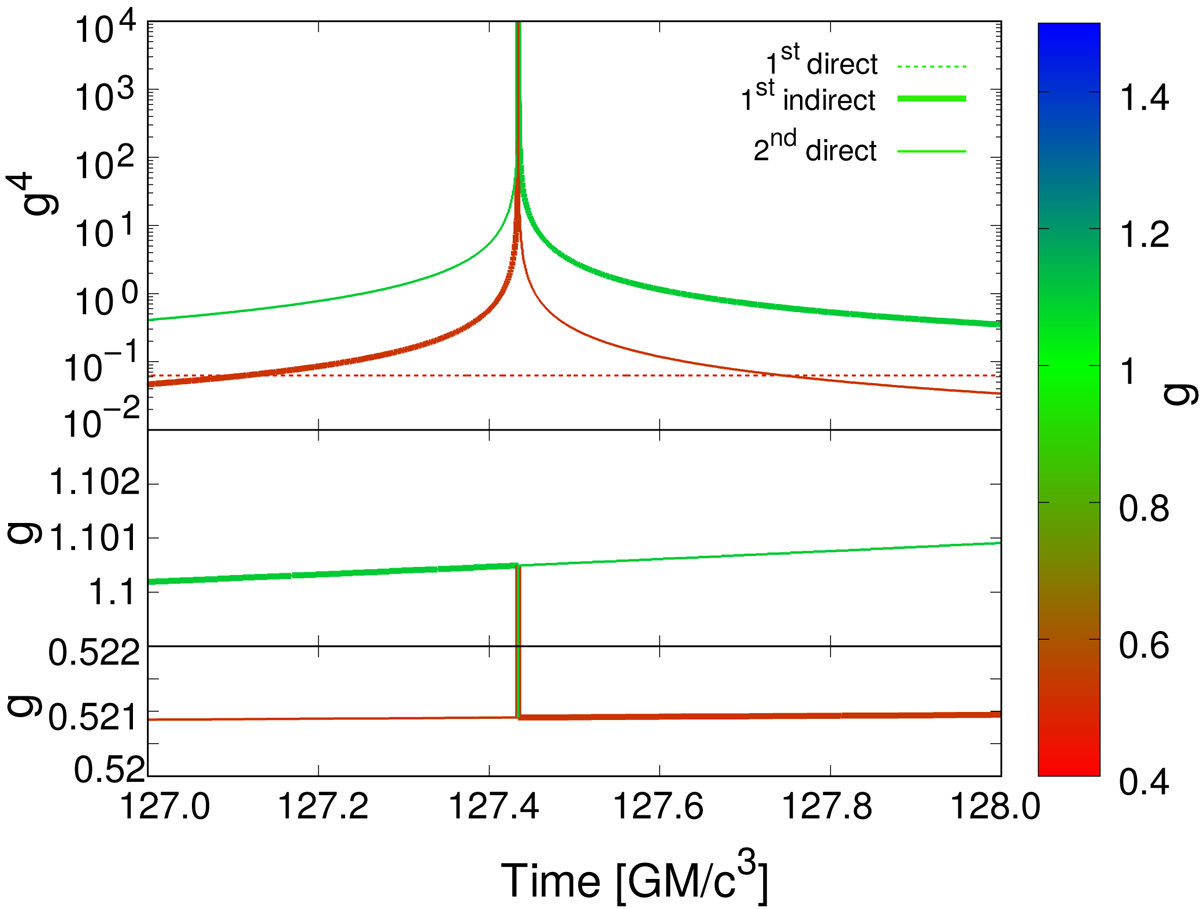
Detail of light curves of the point source in Keplerian circular orbit at R = 6M around the secondary amplification peak. The dashed line represents the first direct image, while the thick and thin continuous lines represent, respectively, the first indirect and second direct images. Top: light curves of both images forming the peak as well as the light curve of the non-amplified first direct image. Bottom: frequency shift factor profiles.
Current usage metrics show cumulative count of Article Views (full-text article views including HTML views, PDF and ePub downloads, according to the available data) and Abstracts Views on Vision4Press platform.
Data correspond to usage on the plateform after 2015. The current usage metrics is available 48-96 hours after online publication and is updated daily on week days.
Initial download of the metrics may take a while.