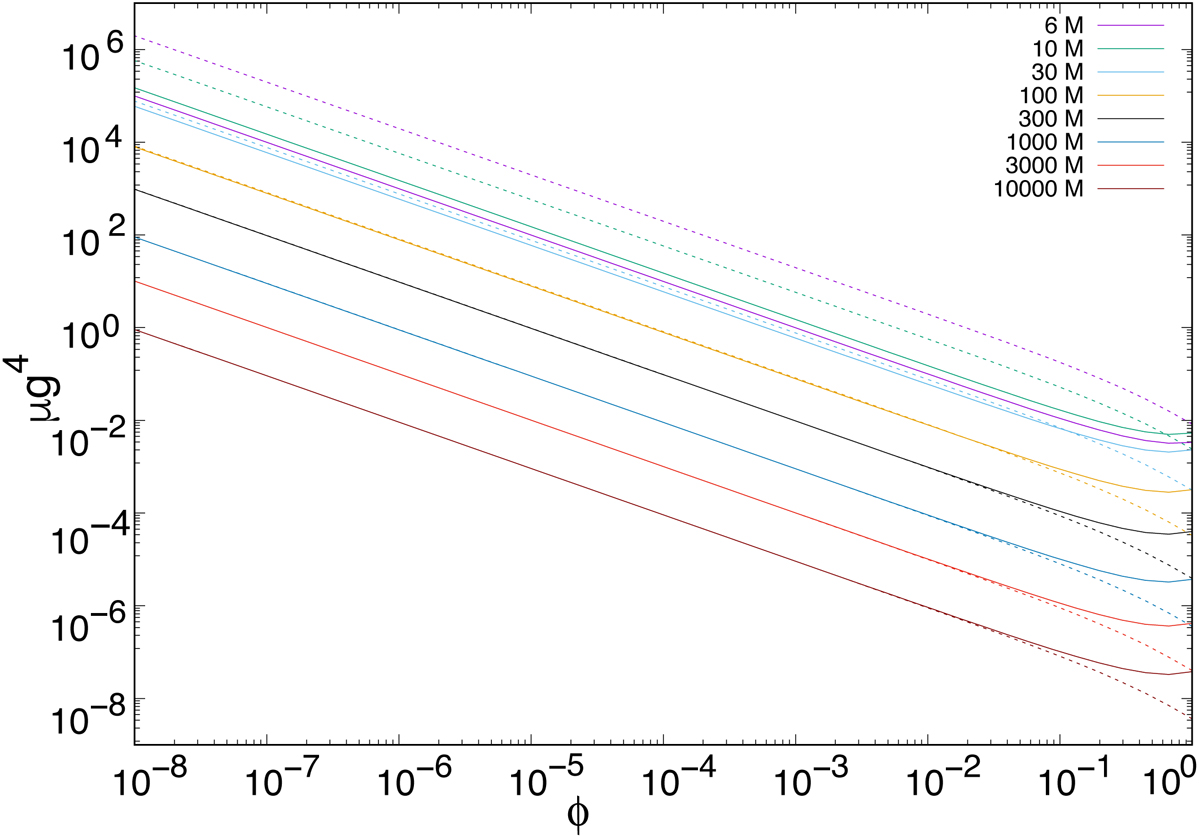
Fig. 16.
Download original image
Secondary amplification peak of a source on a Keplerian circular orbit. The bolometric amplification of the first indirect and the second direct images of a source moving away from the observer (moving away from the caustic line) is plotted as a function of angular separation, ϕ, at different source distances, R. The solid lines correspond to the first direct images, and the dashed line corresponds to the first indirect images.
Current usage metrics show cumulative count of Article Views (full-text article views including HTML views, PDF and ePub downloads, according to the available data) and Abstracts Views on Vision4Press platform.
Data correspond to usage on the plateform after 2015. The current usage metrics is available 48-96 hours after online publication and is updated daily on week days.
Initial download of the metrics may take a while.