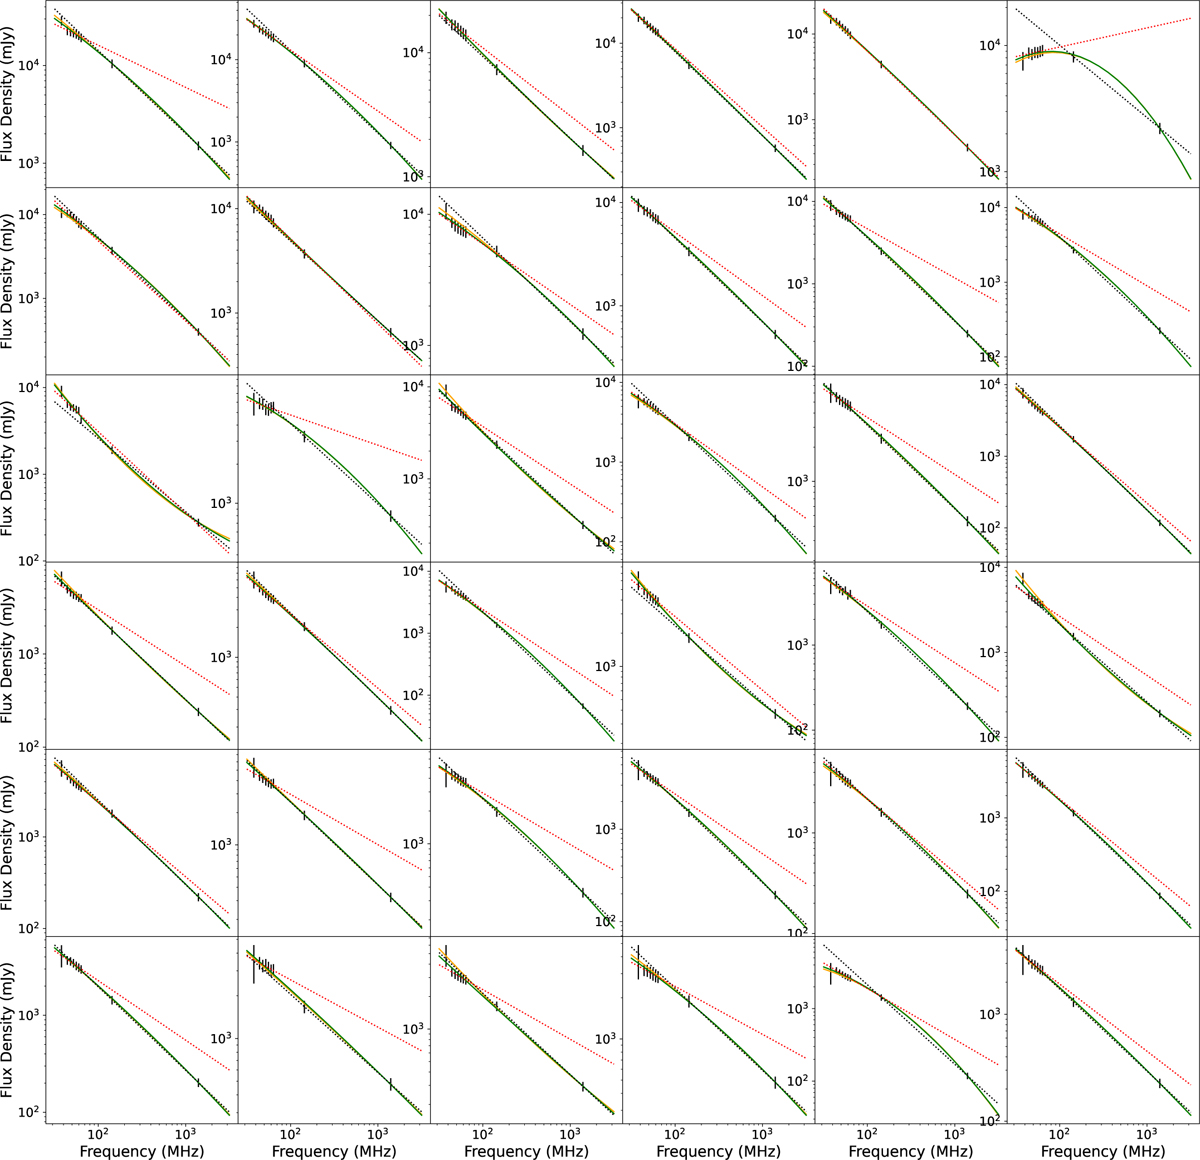
Fig. 20
Download original image
Examples of radio SEDs of isolated bright sources with a detected 8C counterpart. In each plot, the black vertical lines show the data points of 8C (38 MHz), LoLSS (44, 48, 52, 56, 60, 64 MHz), LoTSS (144 MHz) and NVSS (1400 MHz) with uncertainties. The black dotted line connects LoTSS and NVSS data points. The red dotted line is a linear regression using only the LoLSS in-band data points. The green line is a 2nd order regression including all data points while the yellow line is a 2nd order regression without considering LoLSS data points. The green and yellow lines are almost always superimposed.
Current usage metrics show cumulative count of Article Views (full-text article views including HTML views, PDF and ePub downloads, according to the available data) and Abstracts Views on Vision4Press platform.
Data correspond to usage on the plateform after 2015. The current usage metrics is available 48-96 hours after online publication and is updated daily on week days.
Initial download of the metrics may take a while.