Fig. 19
Download original image
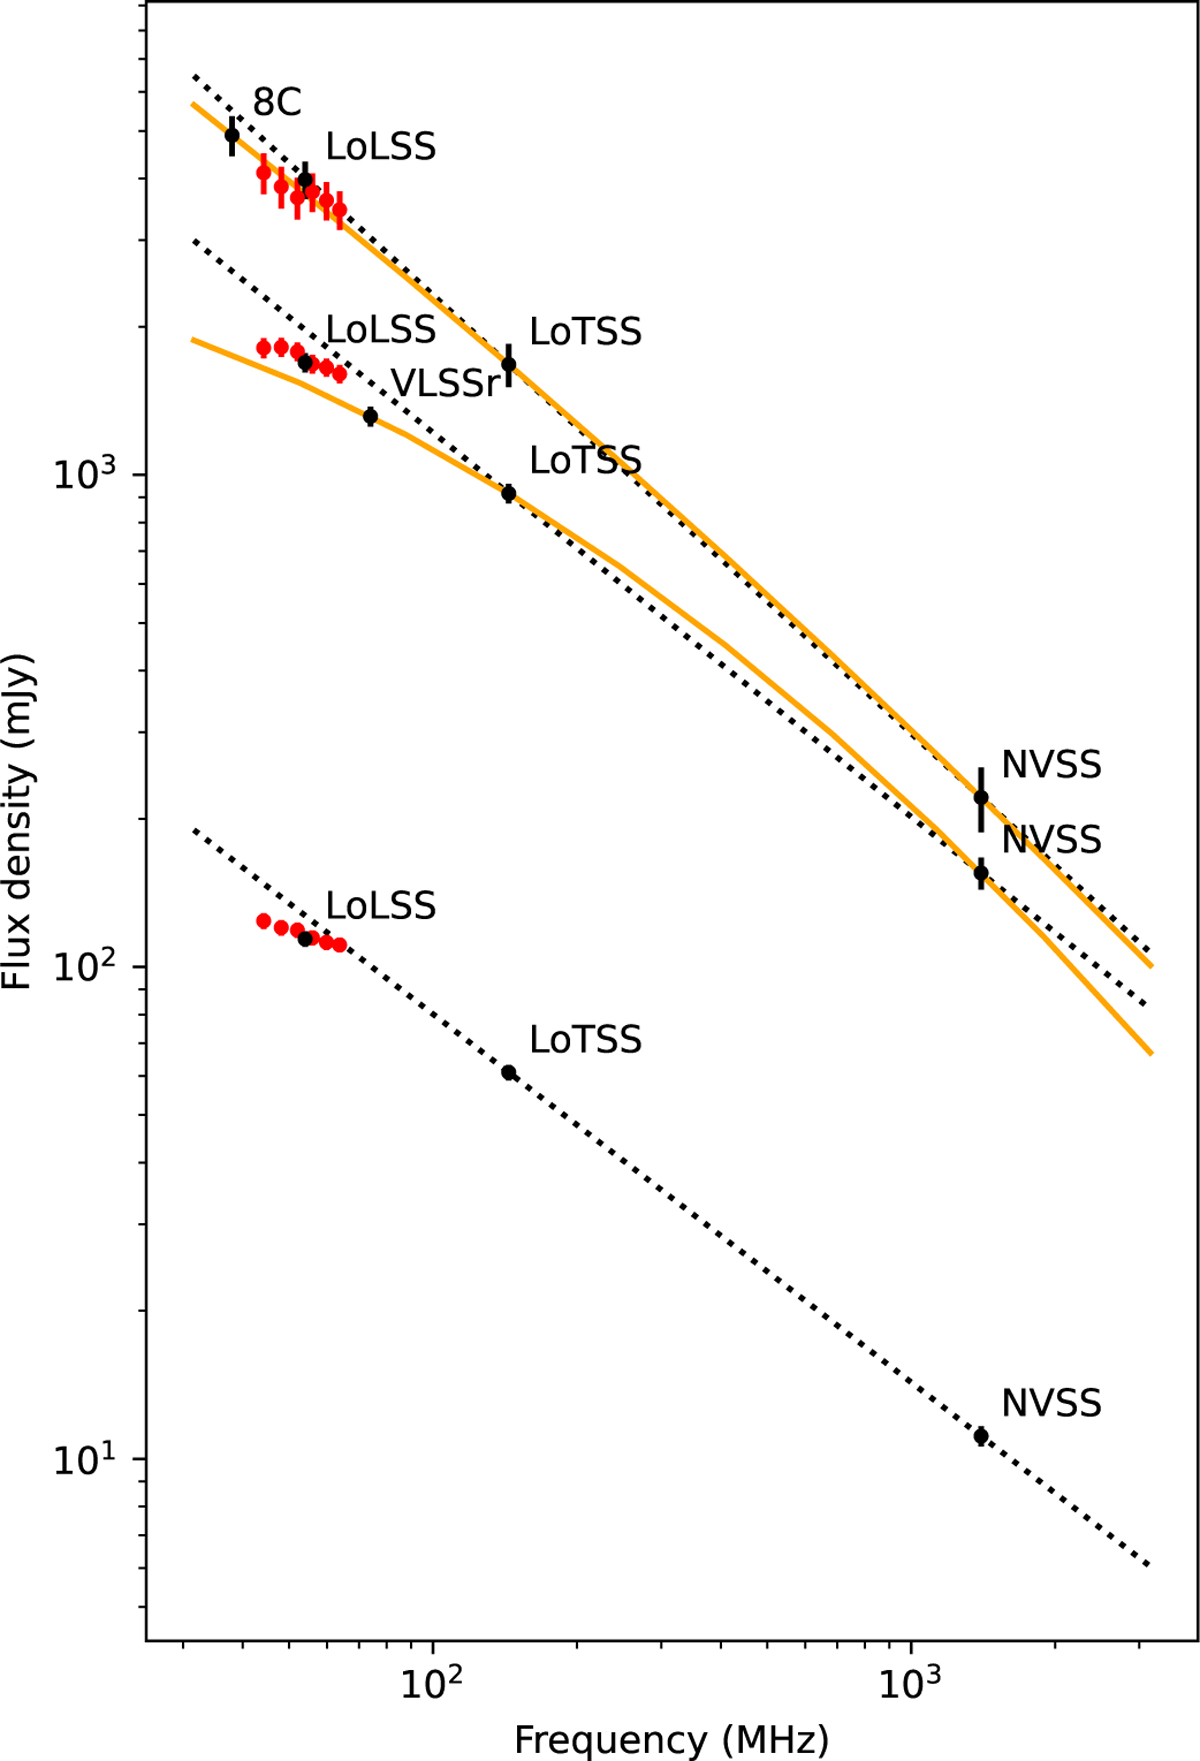
Median flux densities of all matched sources for 8C, LoLSS, LoTSS, and NVSS (61 sources; top line), LoLSS, VLSSr, LoTSS, and NVSS (130 sources; mid line) and LoLSS, LoTSS, and NVSS (4 895 sources; bottom line). In red are the LoLSS in-band flux densities. The height of the lines shows the uncertainty on the median. Black dotted lines are linear polynomials derived from NVSS and LoTSS values in all cases. Yellow line is the quadratic polynomial derived from 8C/VLSSr, LoTSS, and NVSS.
Current usage metrics show cumulative count of Article Views (full-text article views including HTML views, PDF and ePub downloads, according to the available data) and Abstracts Views on Vision4Press platform.
Data correspond to usage on the plateform after 2015. The current usage metrics is available 48-96 hours after online publication and is updated daily on week days.
Initial download of the metrics may take a while.