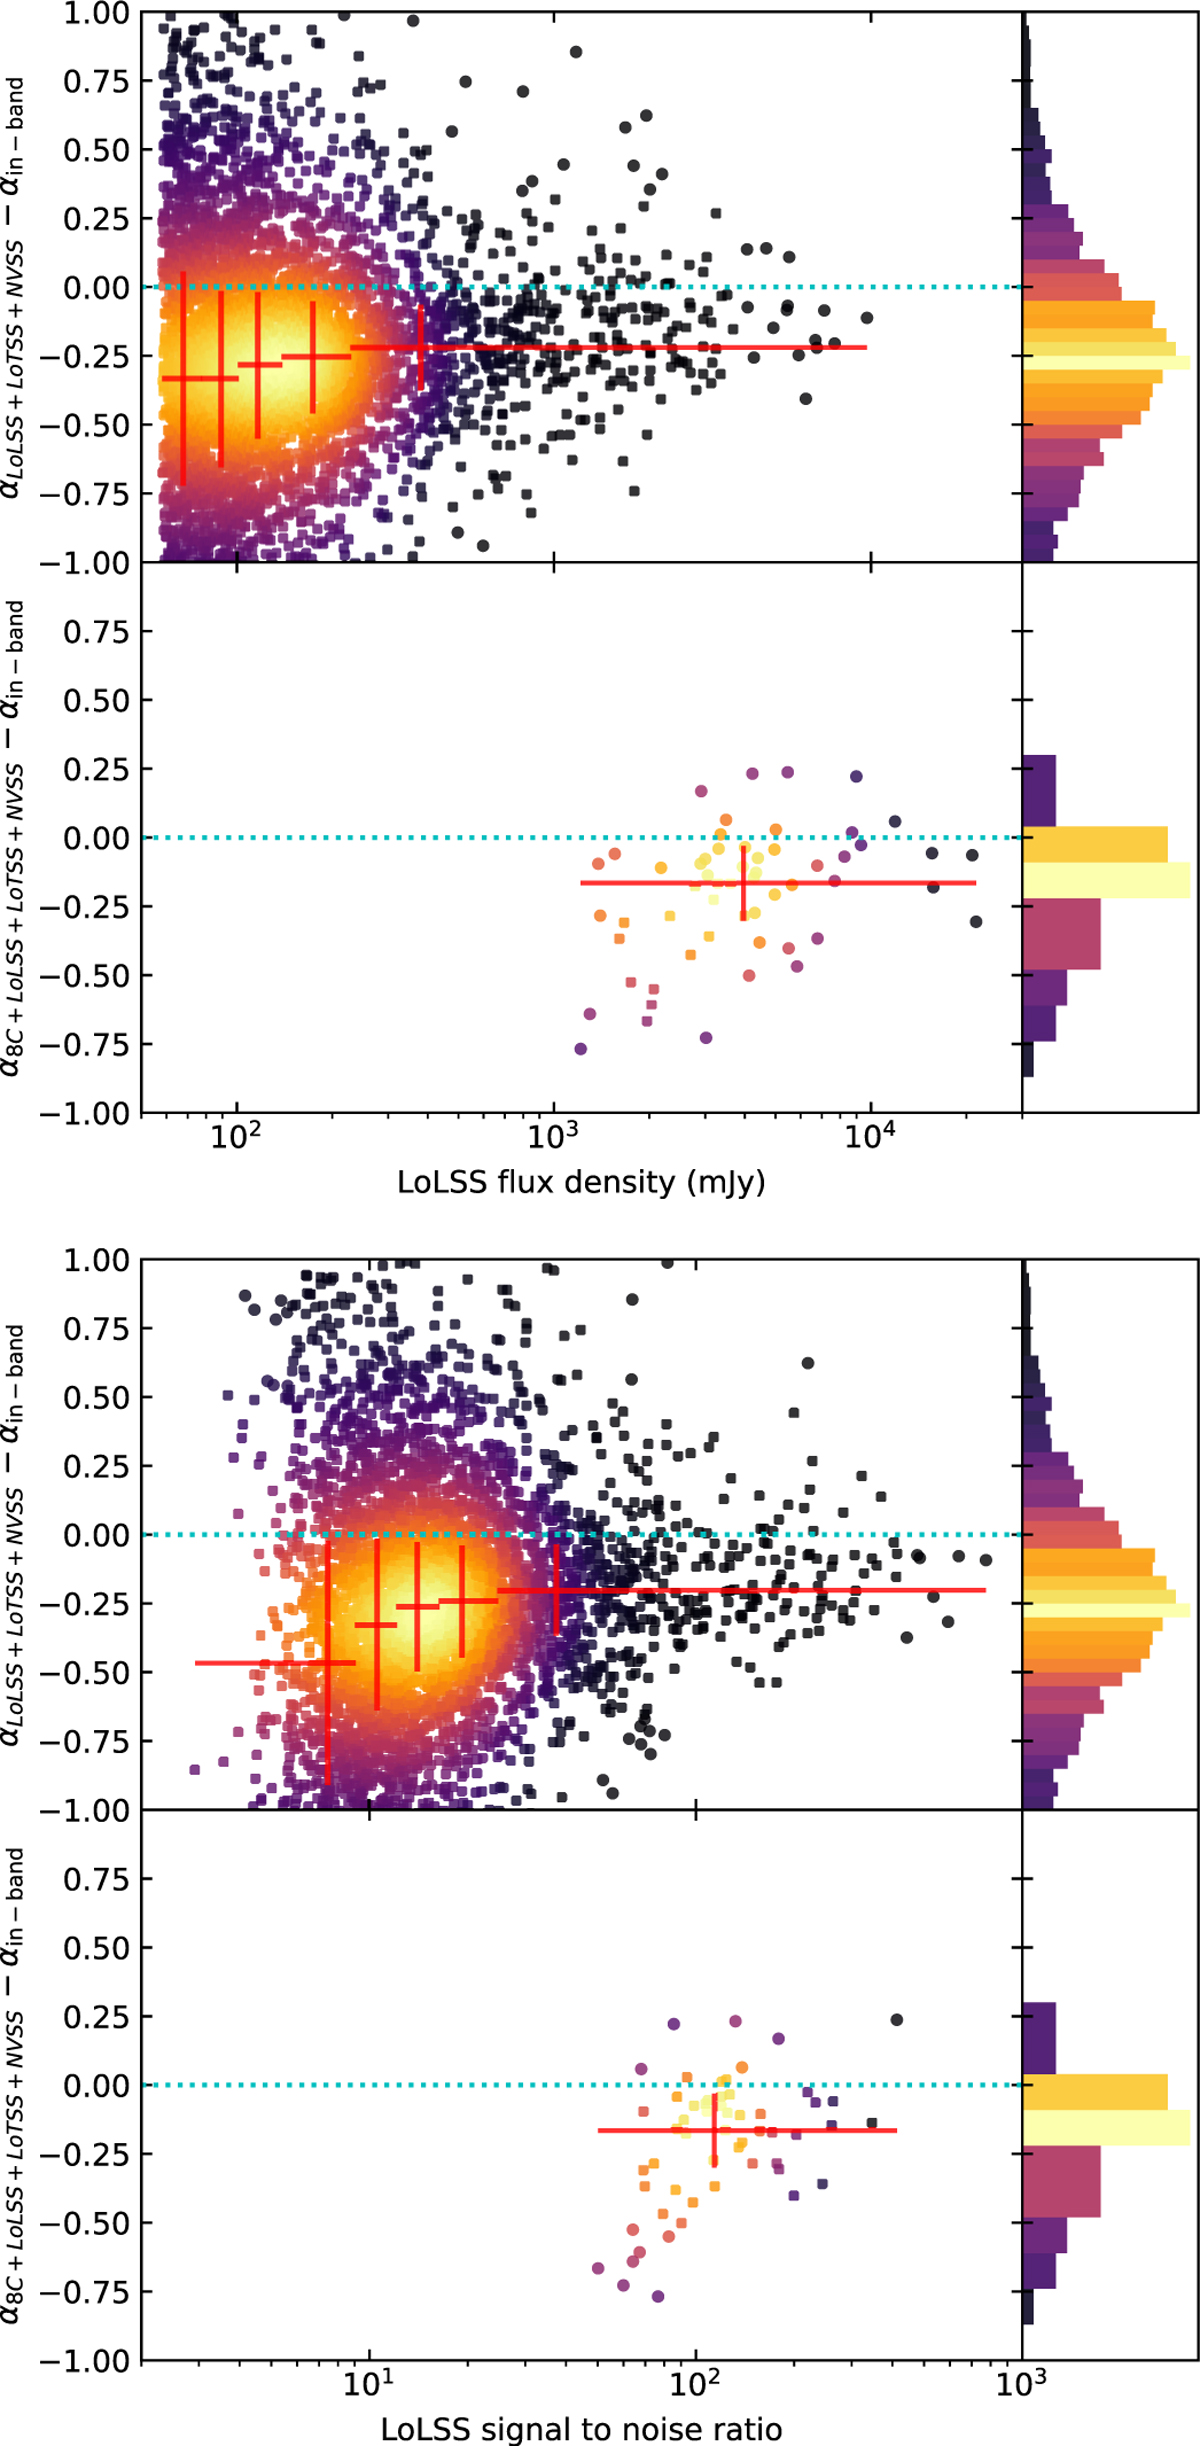
Fig. 18
Download original image
In-band spectral index separation with the tangent of a second order polynomial fit to the SED derived using LoLSS, LoTSS, and NVSS (top panel of each figure) and 8C, LoLSS, LoTSS, and NVSS (bottom panel of each figure). The two figures show the spectral index difference as a function of flux density (top) and signal-to-noise ratio (bottom). Red crosses are binned medians with ±1 median absolute deviation showed as an extension in the y-direction and the bin size as an extension in the x-direction. The average in-band spectral index results flatter than expectations.
Current usage metrics show cumulative count of Article Views (full-text article views including HTML views, PDF and ePub downloads, according to the available data) and Abstracts Views on Vision4Press platform.
Data correspond to usage on the plateform after 2015. The current usage metrics is available 48-96 hours after online publication and is updated daily on week days.
Initial download of the metrics may take a while.