Fig. 16
Download original image
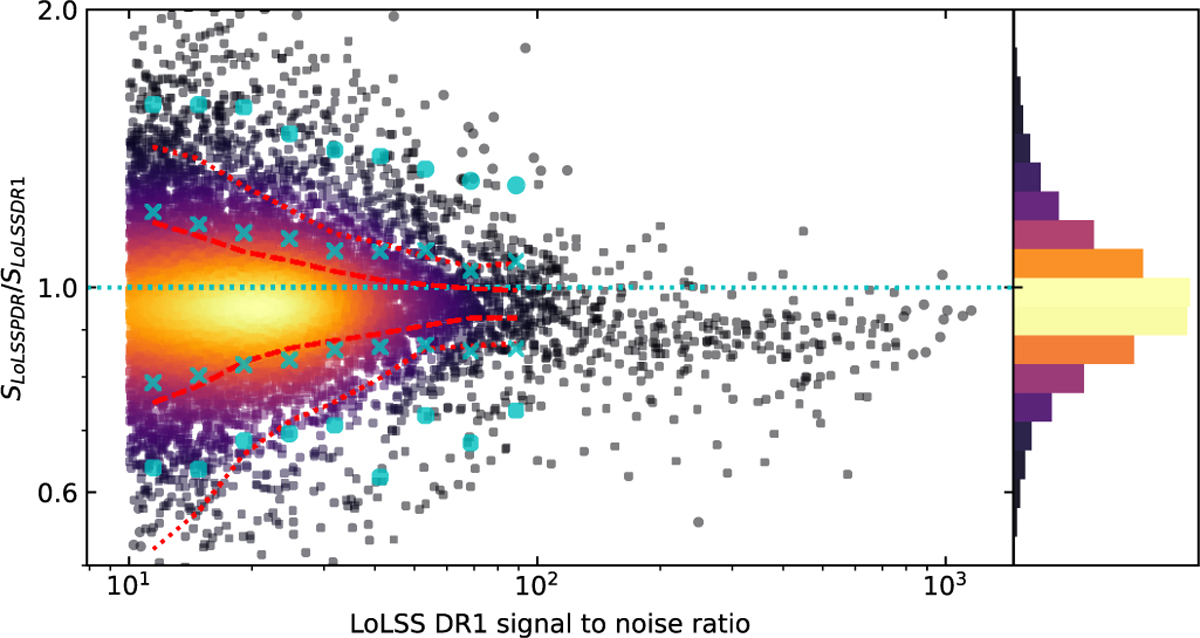
Ratio of the flux densities of matched sources in LoLSS PDR and DRf as a function of the signal-to-noise ratio in LoLSS DR1. Red dashed and dotted lines are the expectation for the f and 2σ dispersion due to the rms noise in the two surveys, cyan crosses and circles are the 1 and 2σ points evaluated in various bins showing larger wings compared to expectations.
Current usage metrics show cumulative count of Article Views (full-text article views including HTML views, PDF and ePub downloads, according to the available data) and Abstracts Views on Vision4Press platform.
Data correspond to usage on the plateform after 2015. The current usage metrics is available 48-96 hours after online publication and is updated daily on week days.
Initial download of the metrics may take a while.