Fig. 15
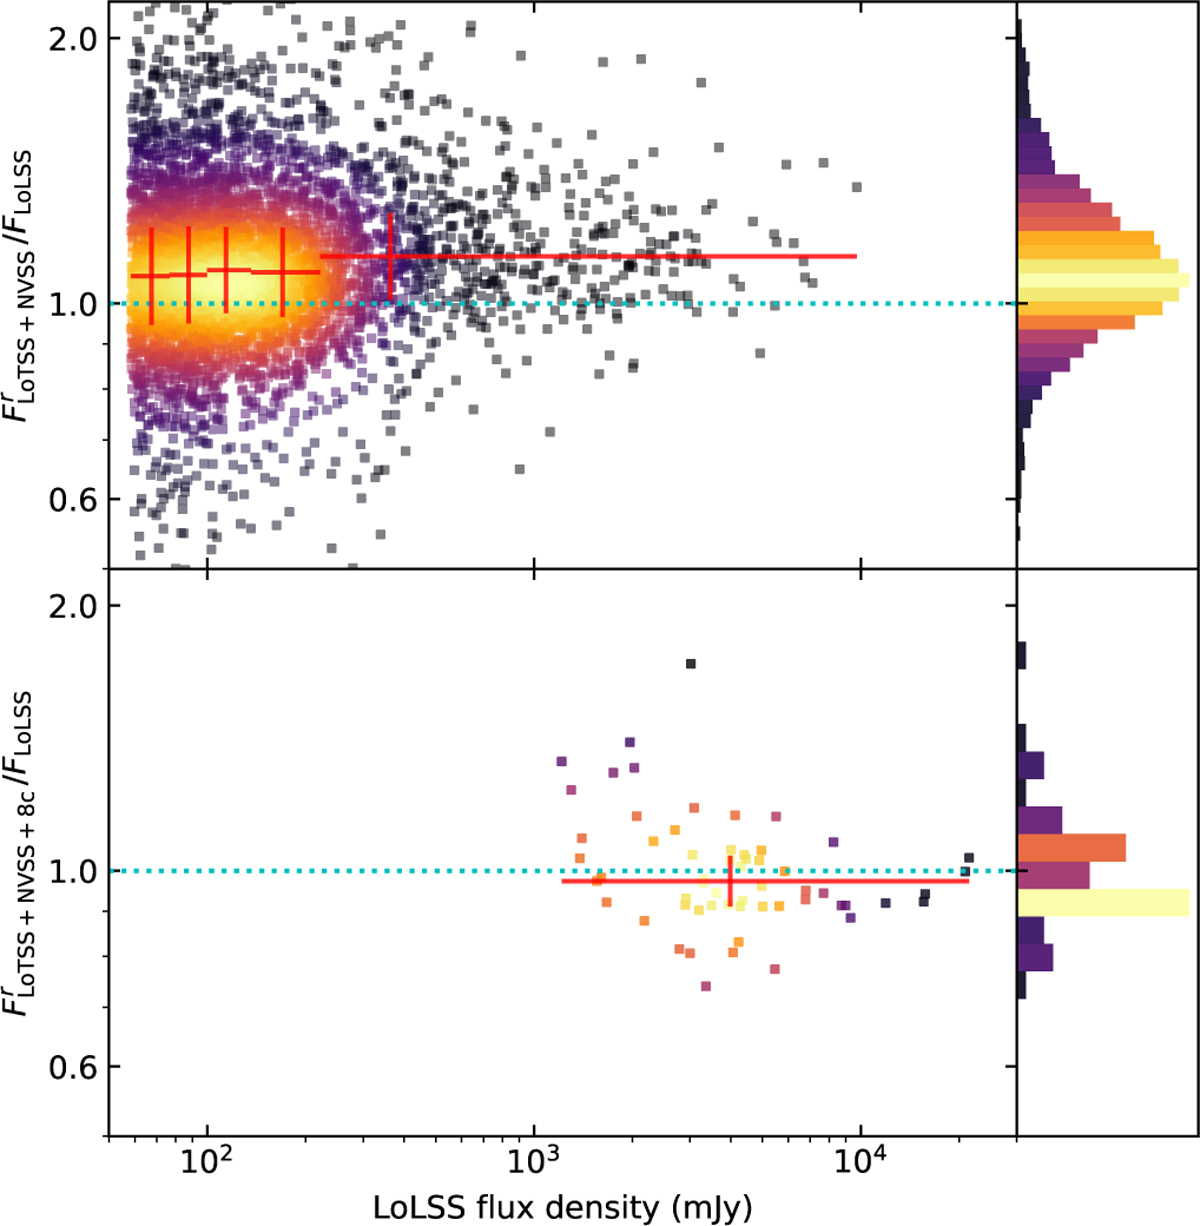
Download original image
LoLSS flux density versus the expected flux density at 54 MHz from the linear extrapolation of the spectral energy distribution (SED) using NVSS and LoTSS (top panel) or from a quadratic polynomial SED estimated using NVSS, LoTSS, and 8C (bottom panel). A ratio of 1, the blue dotted lines, means a perfect match between the prediction and the flux density measured in LoLSS. Red crosses are binned medians (five bins for the top panel, one for the bottom) with ±1 median absolute deviation shown as an extension in the y-direction and the bin size as an extension in the x-direction.
Current usage metrics show cumulative count of Article Views (full-text article views including HTML views, PDF and ePub downloads, according to the available data) and Abstracts Views on Vision4Press platform.
Data correspond to usage on the plateform after 2015. The current usage metrics is available 48-96 hours after online publication and is updated daily on week days.
Initial download of the metrics may take a while.