Fig. 13
Download original image
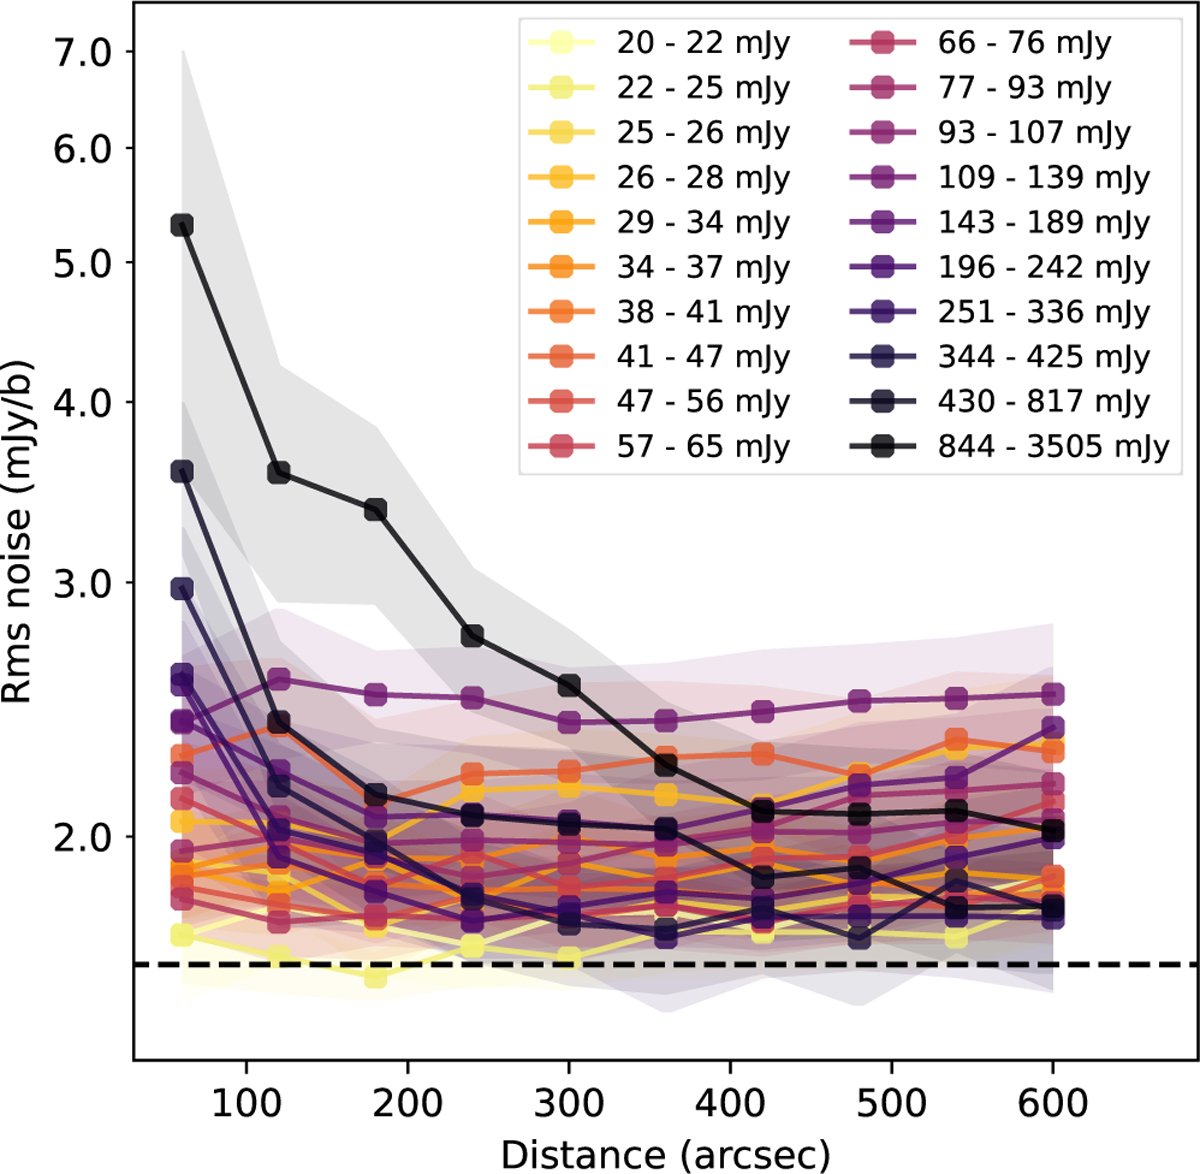
Dynamic range limitation around bright sources. The x-axis shows the distance in arcsec from bright isolated sources. The y-axis shows the local rms noise. Each line represents the median for about 190 sources in different flux density intervals with a shaded region that indicates one median absolute deviation. The black dashed line is at 1.63 mJy beam−1.
Current usage metrics show cumulative count of Article Views (full-text article views including HTML views, PDF and ePub downloads, according to the available data) and Abstracts Views on Vision4Press platform.
Data correspond to usage on the plateform after 2015. The current usage metrics is available 48-96 hours after online publication and is updated daily on week days.
Initial download of the metrics may take a while.