Fig. 12
Download original image
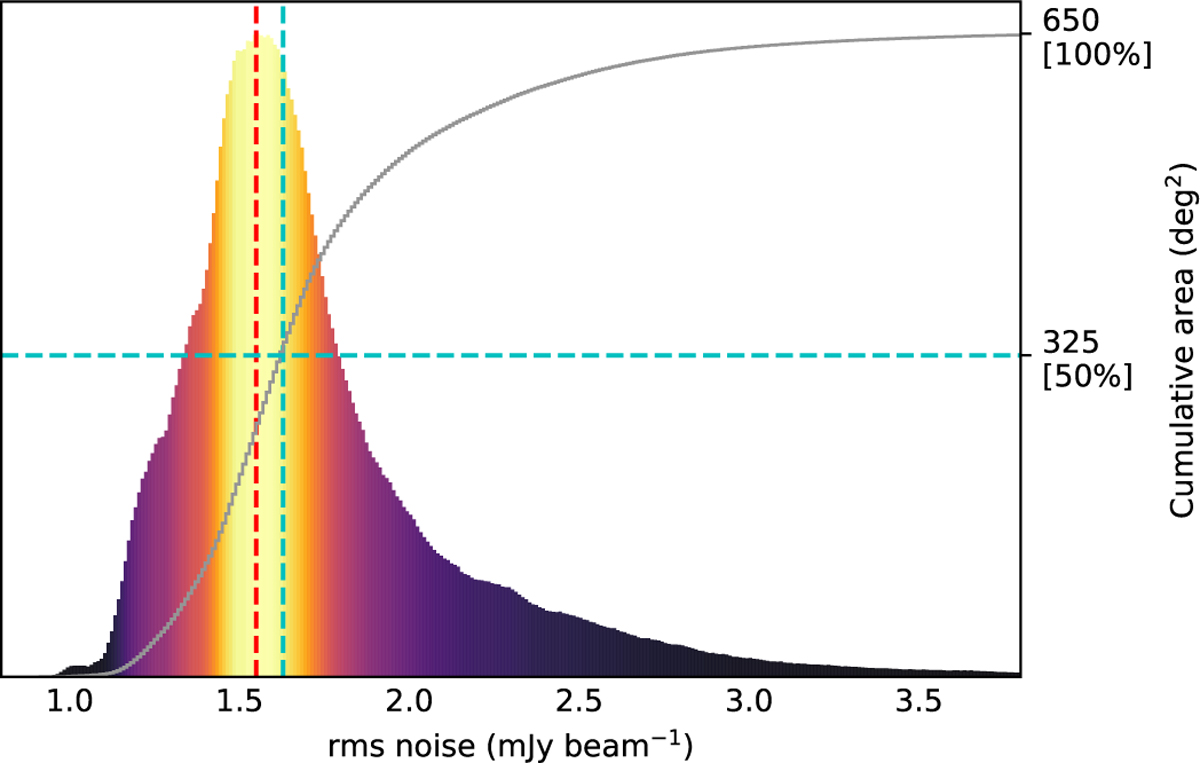
Rms noise histogram of the pixels included in the released region. The solid line shows the cumulative function. The red dashed line indicates the rms value at the peak of the distribution (1.55 mJy beam−1). The blue dashed line shows the position of the 50% percentile (median) at 1.63 mJy beam−1. This means that half of the covered area (325 deg2) has a lower rms noise than that. The long tail of high rms noise values is due to bright sources in the field.
Current usage metrics show cumulative count of Article Views (full-text article views including HTML views, PDF and ePub downloads, according to the available data) and Abstracts Views on Vision4Press platform.
Data correspond to usage on the plateform after 2015. The current usage metrics is available 48-96 hours after online publication and is updated daily on week days.
Initial download of the metrics may take a while.