Fig. 11
Download original image
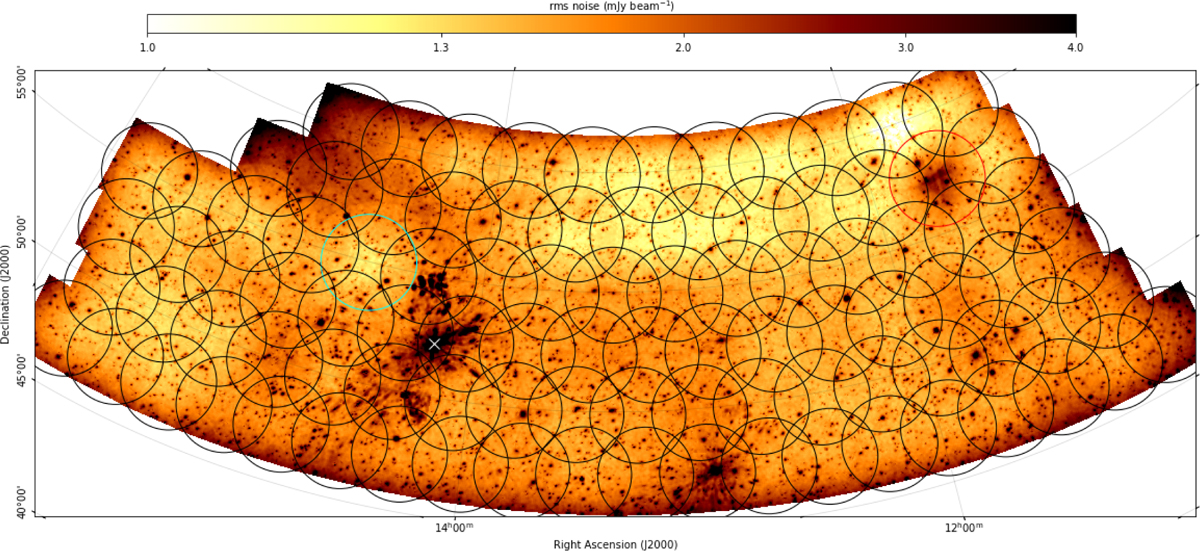
Rms noise map of the LOFAR LBA Sky Survey - DR1. The regions with reduced sensitivity are located around bright sources that induce dynamic range limitations. Each pointing is shown with a circle at the FWHM. The red pointing (P174+57) was not observed, while the blue pointing (P218+55) was observed for 16 hrs (twice as much as the others). The white "x" indicates the position of the bright source 3C 295, which lower the dynamic range in several fields around it.
Current usage metrics show cumulative count of Article Views (full-text article views including HTML views, PDF and ePub downloads, according to the available data) and Abstracts Views on Vision4Press platform.
Data correspond to usage on the plateform after 2015. The current usage metrics is available 48-96 hours after online publication and is updated daily on week days.
Initial download of the metrics may take a while.