Fig. 10
Download original image
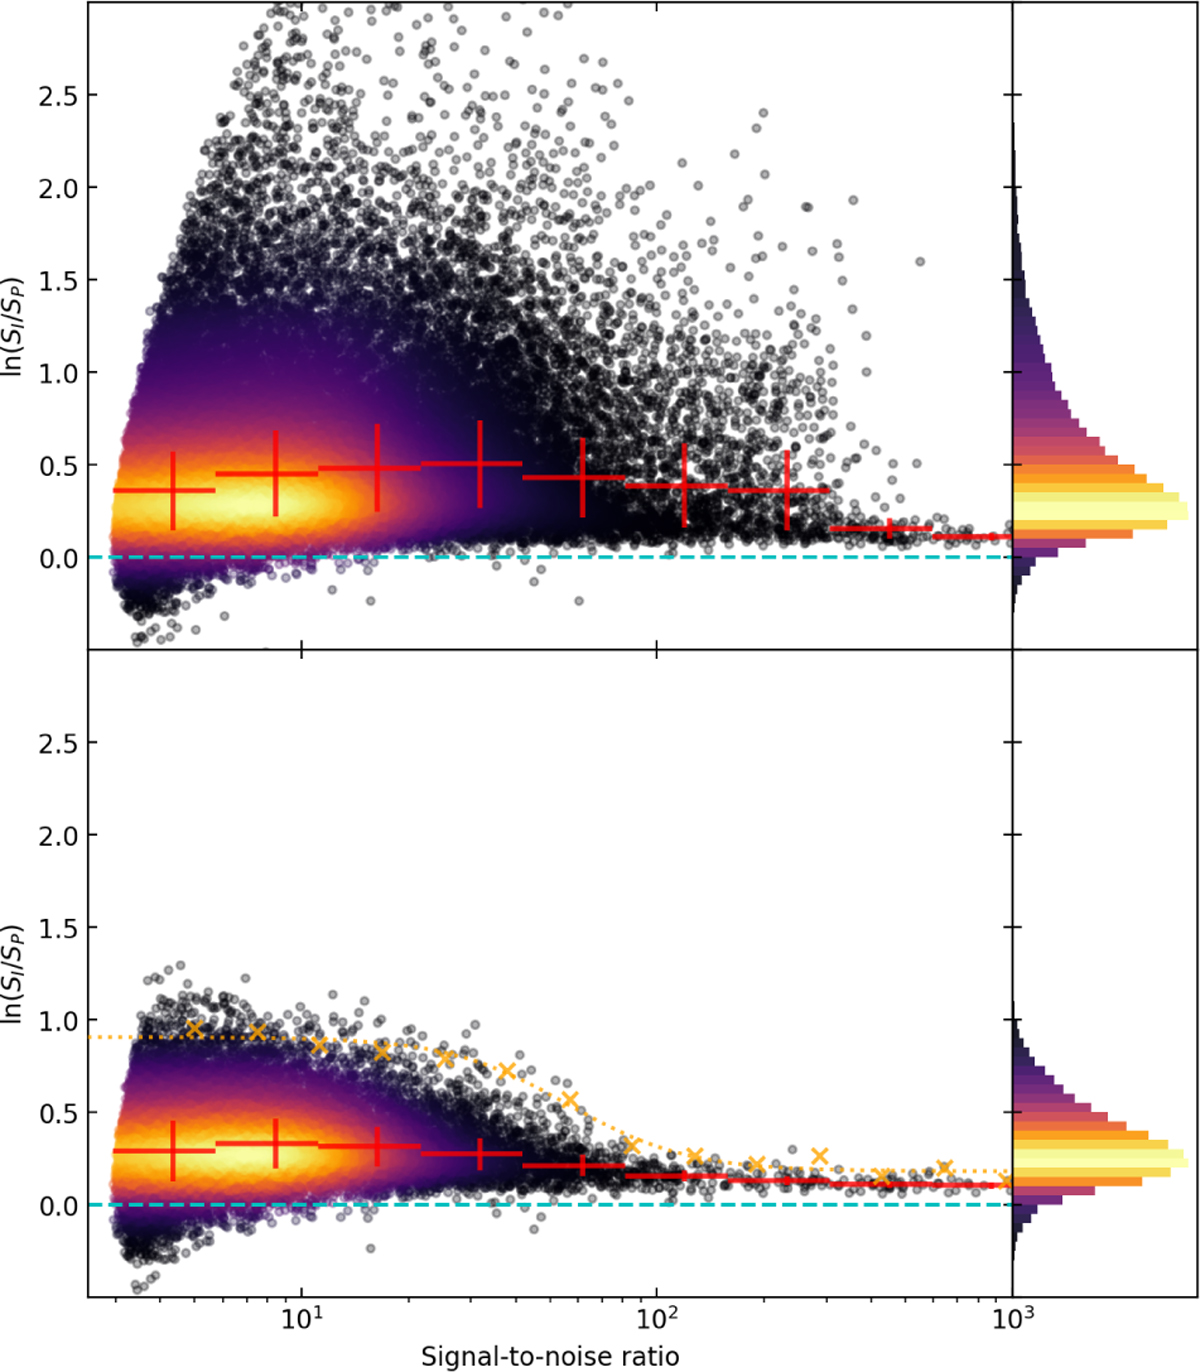
Logarithm of the ratio of integrated to peak flux density plotted against the signal-to-noise ratio as measured by the source finder. A perfect point source would have ln(SI/SP) = 0 (blue dashed line). In the top panel we show all isolated sources present in the catalogue. The bottom panel is restricted to those sources whose cross-match is an isolated point source in LoTSS (see text). Red crosses show the binned median with the extension on the x-axis showing the bin size and on the y-axis showing ±1 median absolute deviation. Orange markers show the position of the 99th percentile of the distribution in each bin. Dotted orange line is a fit to the orange markers positions as explained in the text.
Current usage metrics show cumulative count of Article Views (full-text article views including HTML views, PDF and ePub downloads, according to the available data) and Abstracts Views on Vision4Press platform.
Data correspond to usage on the plateform after 2015. The current usage metrics is available 48-96 hours after online publication and is updated daily on week days.
Initial download of the metrics may take a while.