Open Access
Fig. E.1
Download original image
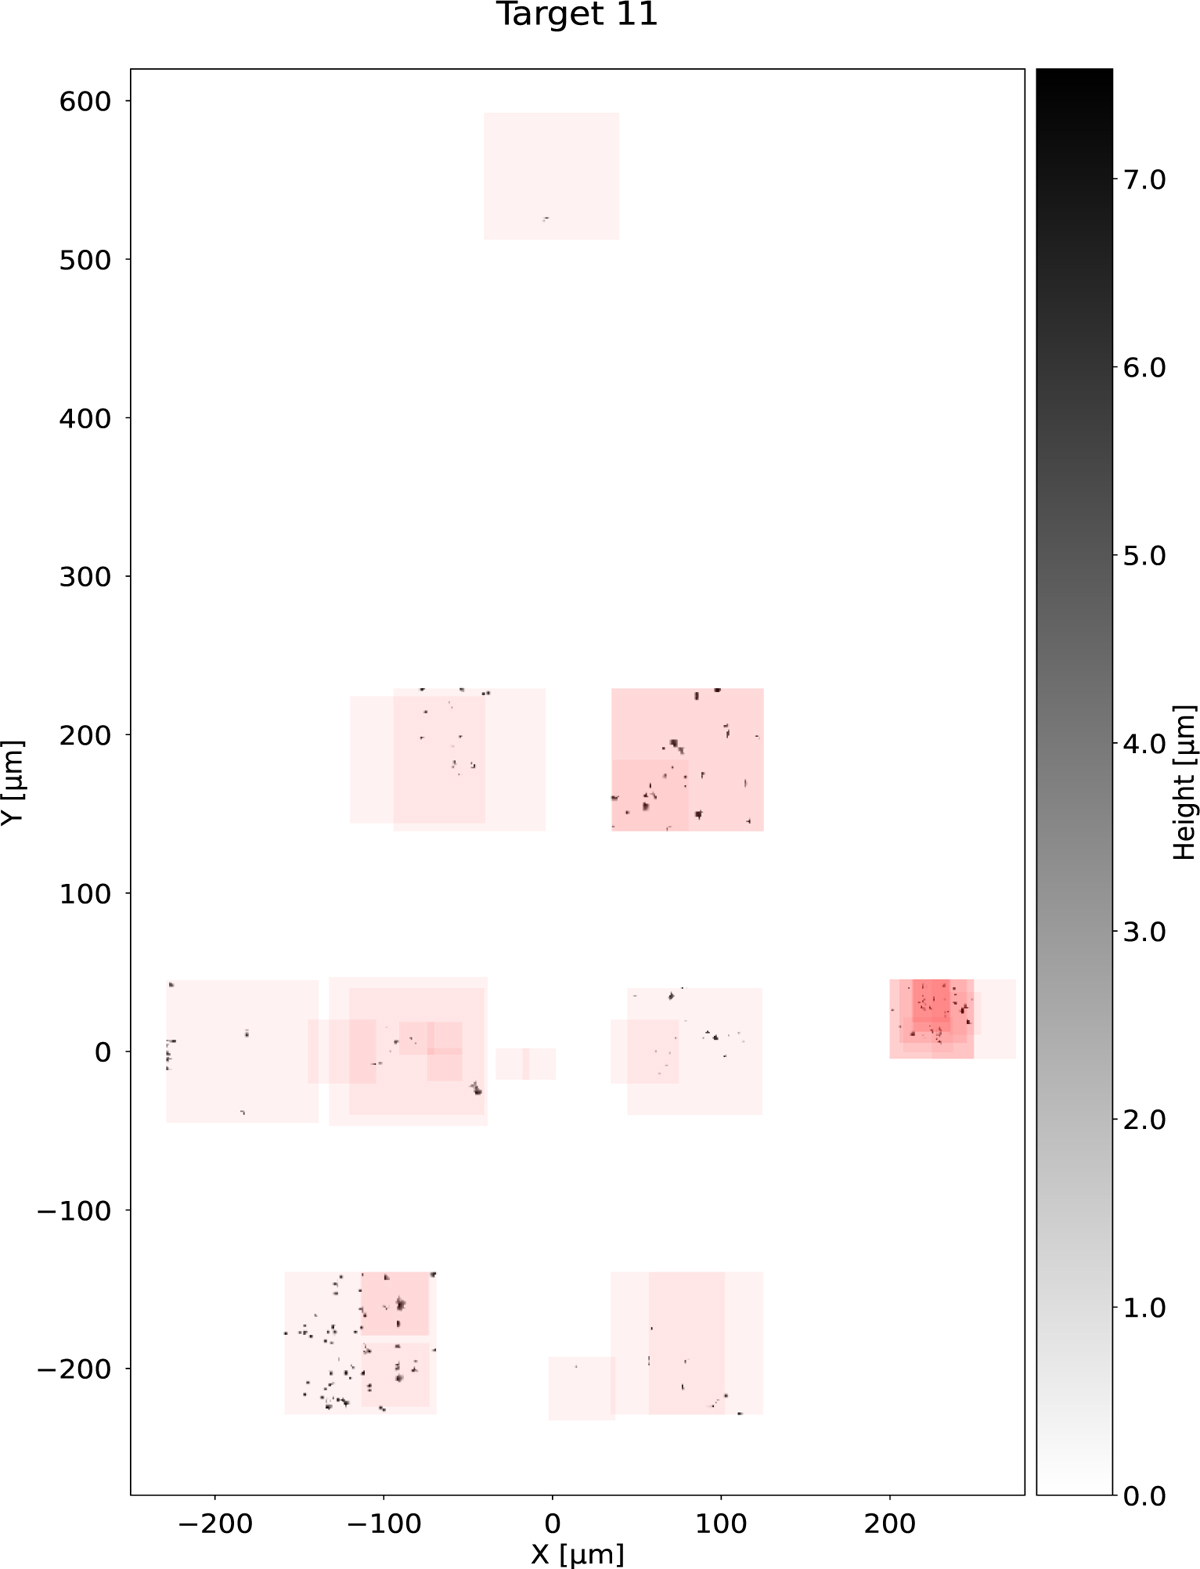
2D dust coverage map of target 11 only including fully imaged particles as selected in Section 3.1.2 with an indicated scanned area (red boxes; overlaying scans create darker red color, thus more intense color indicates iterative scanning).
Current usage metrics show cumulative count of Article Views (full-text article views including HTML views, PDF and ePub downloads, according to the available data) and Abstracts Views on Vision4Press platform.
Data correspond to usage on the plateform after 2015. The current usage metrics is available 48-96 hours after online publication and is updated daily on week days.
Initial download of the metrics may take a while.