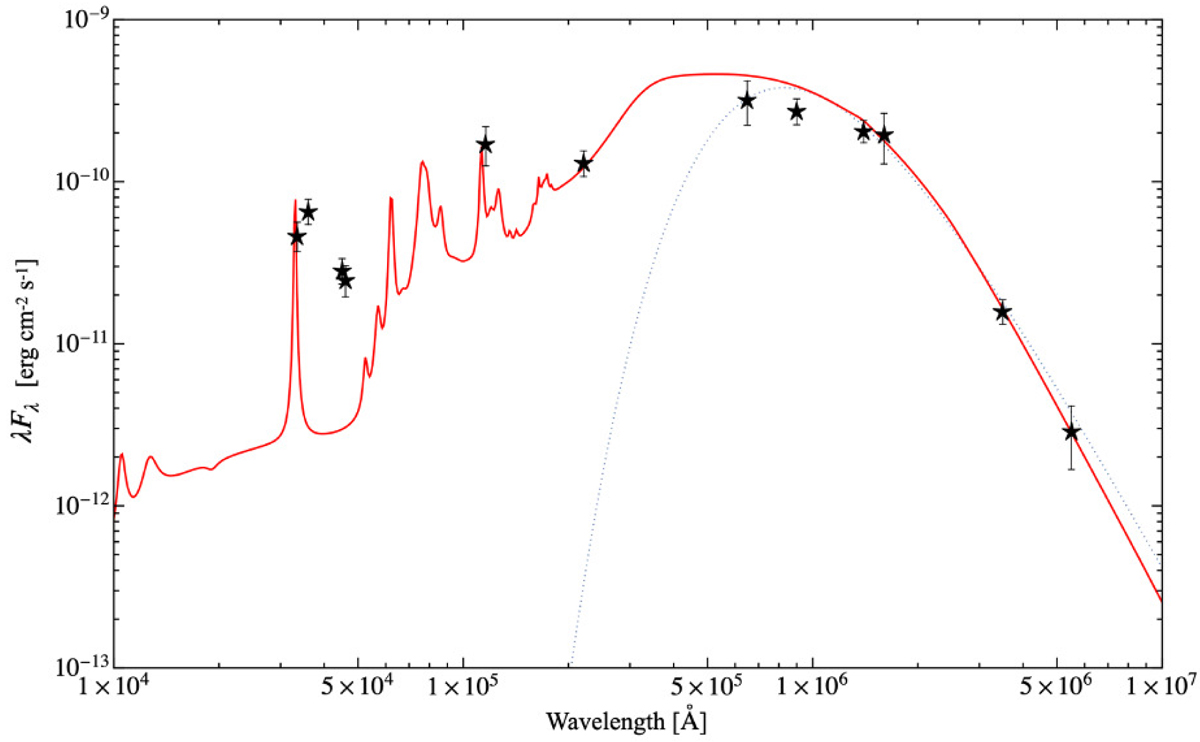
Fig. 7.
Download original image
Averaged SED for the different regions along the limb-brightened bow-shock shell. The proposed tentative fit is plotted as the continuous red line from a dust grain model. The dotted line shows the fit of a single radiation field to the largest wavelengths. Error bars correspond to one standard deviation. See text for details.
Current usage metrics show cumulative count of Article Views (full-text article views including HTML views, PDF and ePub downloads, according to the available data) and Abstracts Views on Vision4Press platform.
Data correspond to usage on the plateform after 2015. The current usage metrics is available 48-96 hours after online publication and is updated daily on week days.
Initial download of the metrics may take a while.