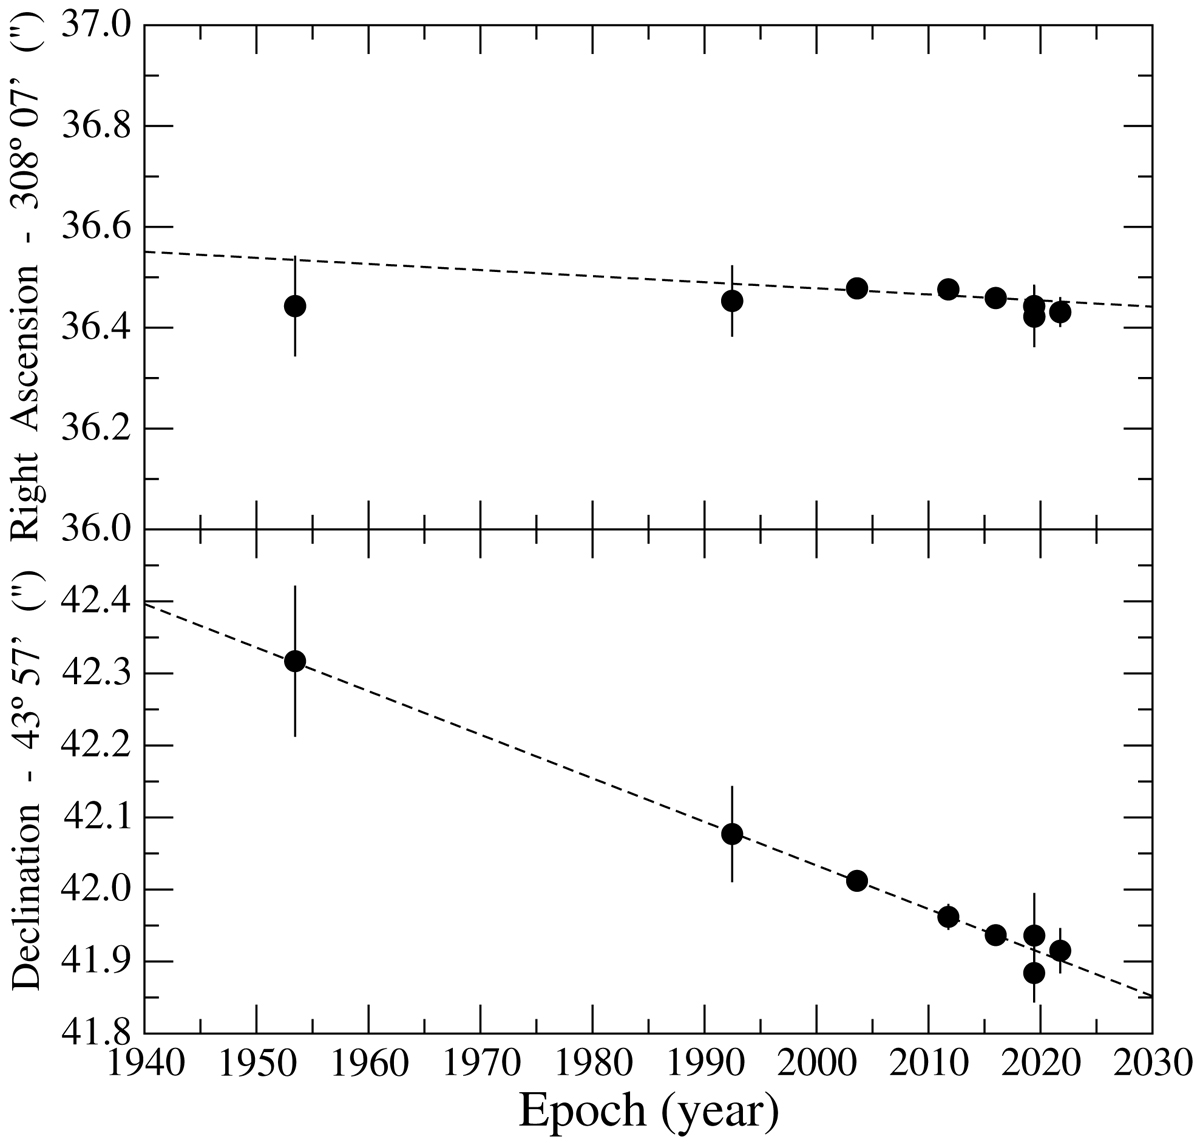
Fig. 2.
Download original image
Least-squares fit to astrometric observations. Data from Table 1 are plotted both in right ascension (top) and declination (bottom) as a function of time. The two celestial coordinates are expressed in the ICRS system. The dashed lines represent linear least-squares fits yielding the estimated proper motions. Error bars correspond to one standard deviation.
Current usage metrics show cumulative count of Article Views (full-text article views including HTML views, PDF and ePub downloads, according to the available data) and Abstracts Views on Vision4Press platform.
Data correspond to usage on the plateform after 2015. The current usage metrics is available 48-96 hours after online publication and is updated daily on week days.
Initial download of the metrics may take a while.