Fig. A.1.
Download original image
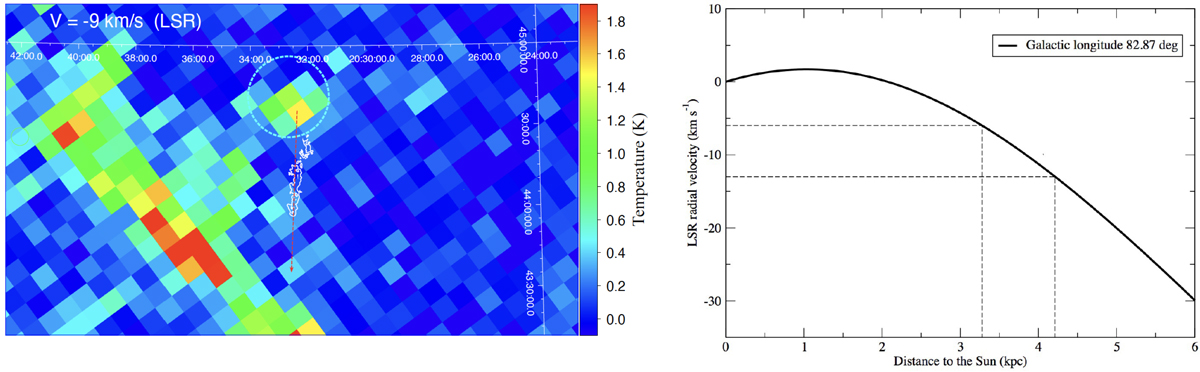
Molecular cloud proposed as the birthplace of UJT-1. (Left). Map of the antenna temperature due to CO emission toward this proposed RATTS corresponding to an LSR velocity of −9 km s−1 as detected in Dame’s survey (Dame et al. 2001). Equatorial coordinates are used. The white contours mark the location of the stellar wake, and the dashed red line shows the inferred direction of the peculiar stellar velocity. A conspicuous gas cloud, outlined by a dashed circle, is visible about 40 arcminutes away in the direction opposite to the velocity. The 30 arcminutes horizontal scale bar is equivalent to about 40 pc at the proposed distance of 4.5 kpc. (Right). Kinematic plot showing the corresponding distance as a function of the LSR velocity within the −13 to −6 km s−1 range (dashed lines) in which the cloud CO emission is detected. A value close to 4 kpc is favored, in agreement with the distance range to UJT-1 based on photometric and spectroscopic considerations.
Current usage metrics show cumulative count of Article Views (full-text article views including HTML views, PDF and ePub downloads, according to the available data) and Abstracts Views on Vision4Press platform.
Data correspond to usage on the plateform after 2015. The current usage metrics is available 48-96 hours after online publication and is updated daily on week days.
Initial download of the metrics may take a while.