Open Access
Fig. 12
Download original image
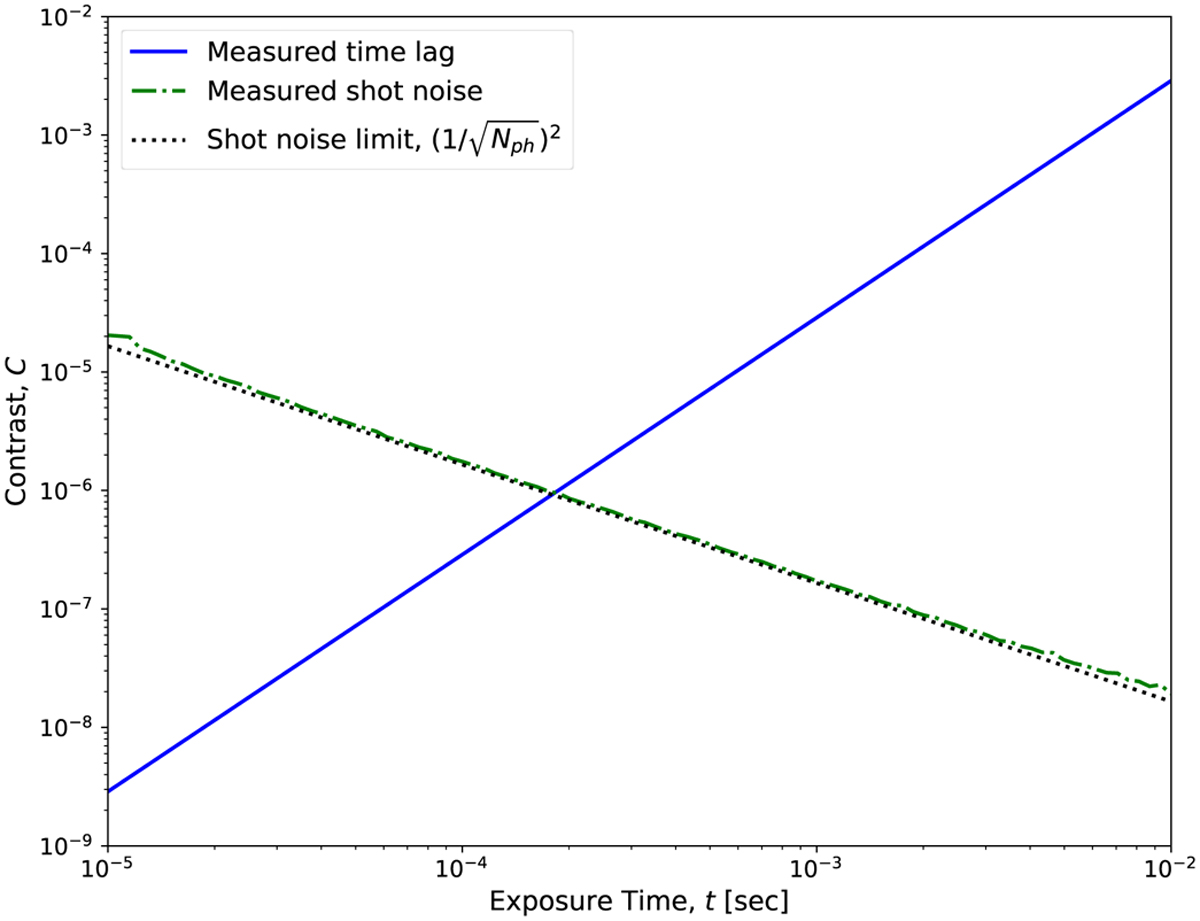
Noise analysis results for practical implementations. The parameters used in this analysis are listed in Table 1. The solid blue line indicates the measured time lag. The dash-dotted green line represents the measured shot noise, and the dotted black line shows the theoretical shot noise limit.
Current usage metrics show cumulative count of Article Views (full-text article views including HTML views, PDF and ePub downloads, according to the available data) and Abstracts Views on Vision4Press platform.
Data correspond to usage on the plateform after 2015. The current usage metrics is available 48-96 hours after online publication and is updated daily on week days.
Initial download of the metrics may take a while.