Fig. 7
Download original image
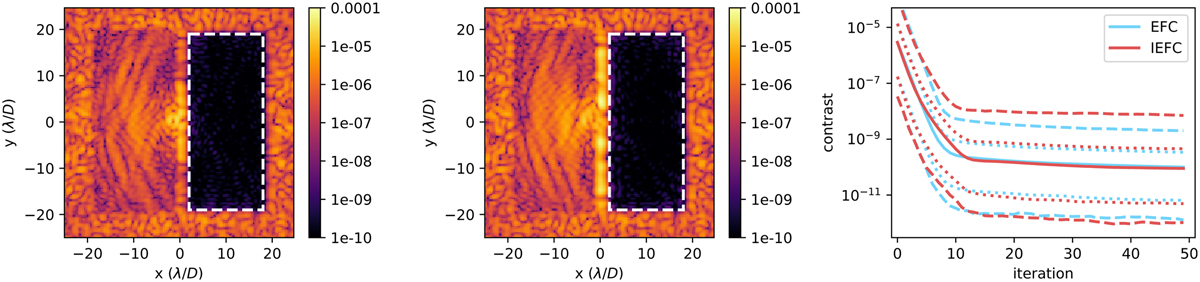
A comparison between conventional EFC and iEFC. The left figure shows the post-coronagraphic image of EFC and the middle figure shows the post-coronagrahpic image of iEFC. The distribution of the contrast as a function of time is shown on the right. The blue and red line show the results for EFC and iEFC, respectively. The various line styles represent different quantiles; the dashed lines represents the 1 and 99% quantiles, the dotted lines follow the 16 and 84% quantiles and the solid line is the 50% quantile (median contrast). Both methods converge within 10 iterations to the same median contrast of a few times 10−10. The 99% quantile shows that iEFC has several brighter pixels than EFC.
Current usage metrics show cumulative count of Article Views (full-text article views including HTML views, PDF and ePub downloads, according to the available data) and Abstracts Views on Vision4Press platform.
Data correspond to usage on the plateform after 2015. The current usage metrics is available 48-96 hours after online publication and is updated daily on week days.
Initial download of the metrics may take a while.