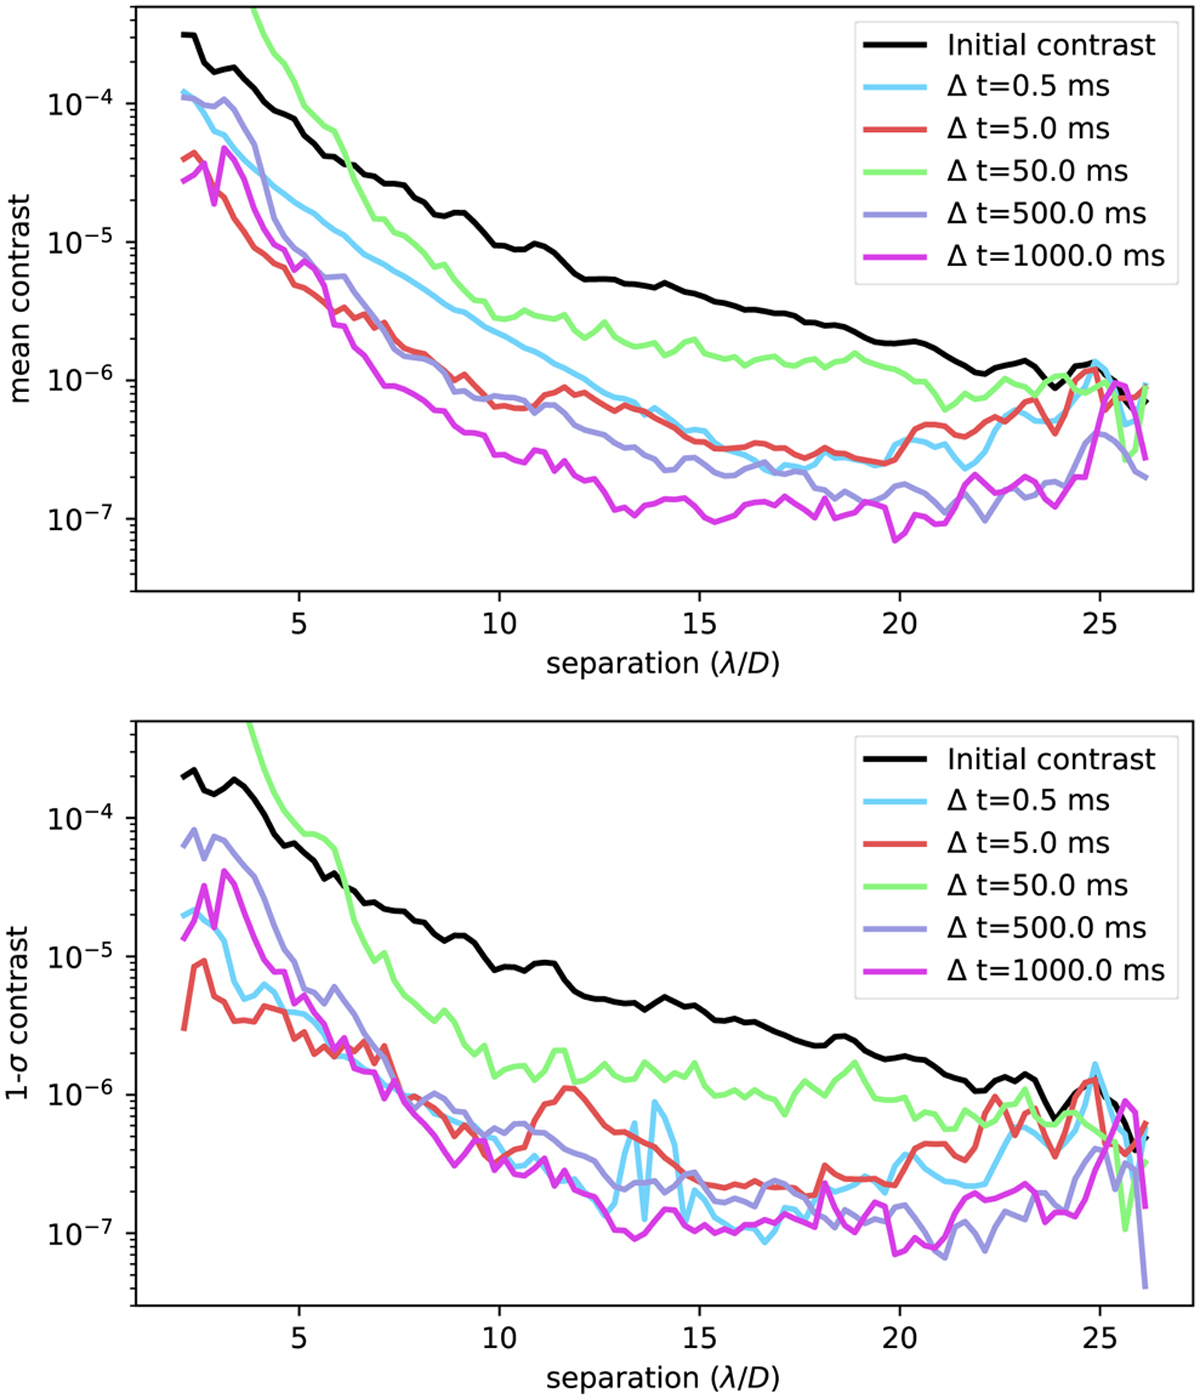
Fig. 6
Download original image
Spatial radial profile of the quasi-static speckles in the dark hole after one second of closed-loop operation. The top figure shows the mean radial profile in the dark hole for different exposure times and, the bottom figures shows the radial standard deviation for each angular separation. The black line corresponds to the input profile for the quasi-static speckles. The shortest exposure lead to a smooth residual halo, which shows how the atmospheric halo leaks into the quasi-statics. The results for 50 ms exposures always diverge regardless of closed-loop gains and regularization.
Current usage metrics show cumulative count of Article Views (full-text article views including HTML views, PDF and ePub downloads, according to the available data) and Abstracts Views on Vision4Press platform.
Data correspond to usage on the plateform after 2015. The current usage metrics is available 48-96 hours after online publication and is updated daily on week days.
Initial download of the metrics may take a while.