Fig. 11
Download original image
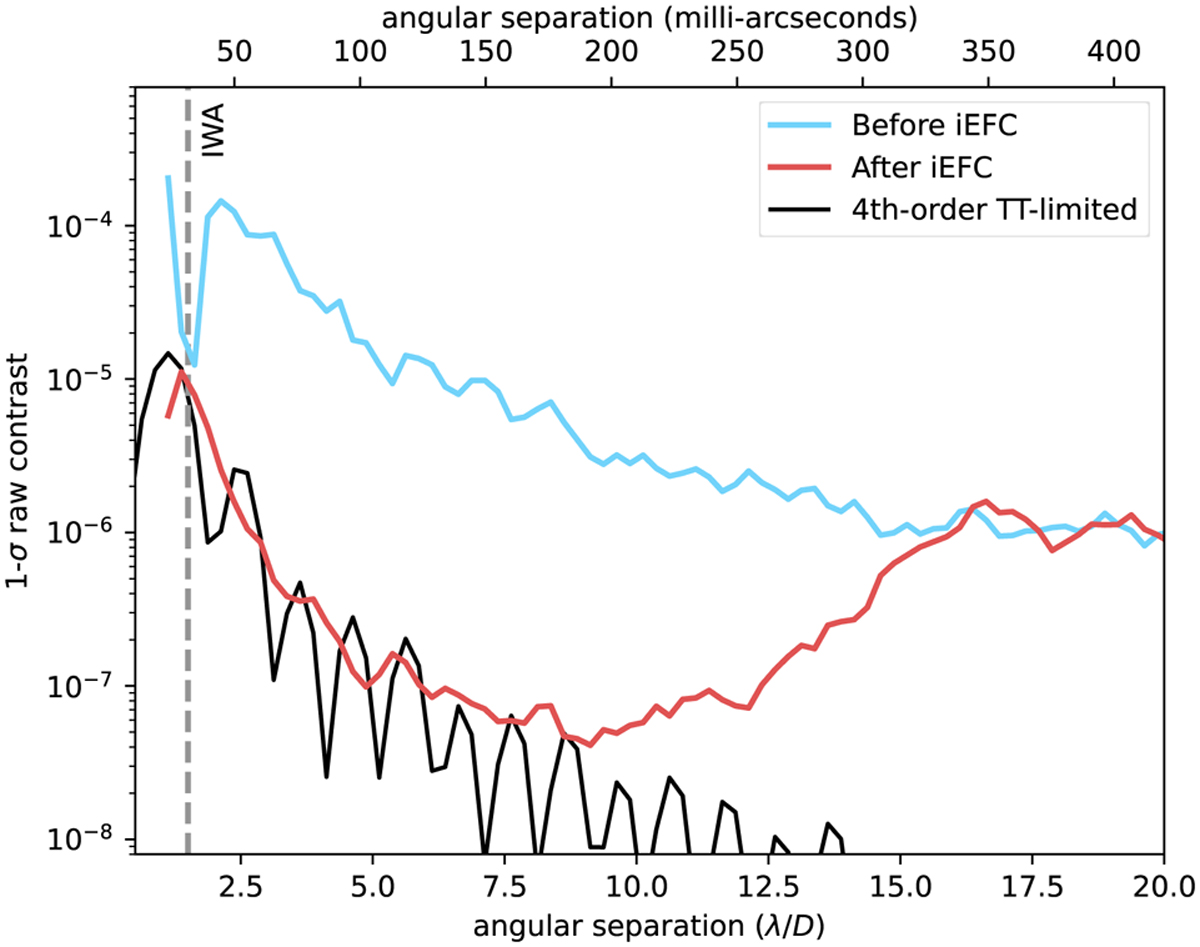
Radial profile before and after iEFC with the PAPLC in the narrowband Hα filter. The blue line and red line show the contrast before and after waveſront control, respectively. The contrast is two orders of magnitude lower after control. The black line shows the contrast profile for a theoretical 4th-order coronagraph that is limited by the measured MagAO-X jitter. The contrast after iEFC follows a similar decay as the 4th-order coronagraph.
Current usage metrics show cumulative count of Article Views (full-text article views including HTML views, PDF and ePub downloads, according to the available data) and Abstracts Views on Vision4Press platform.
Data correspond to usage on the plateform after 2015. The current usage metrics is available 48-96 hours after online publication and is updated daily on week days.
Initial download of the metrics may take a while.