Fig. 1
Download original image
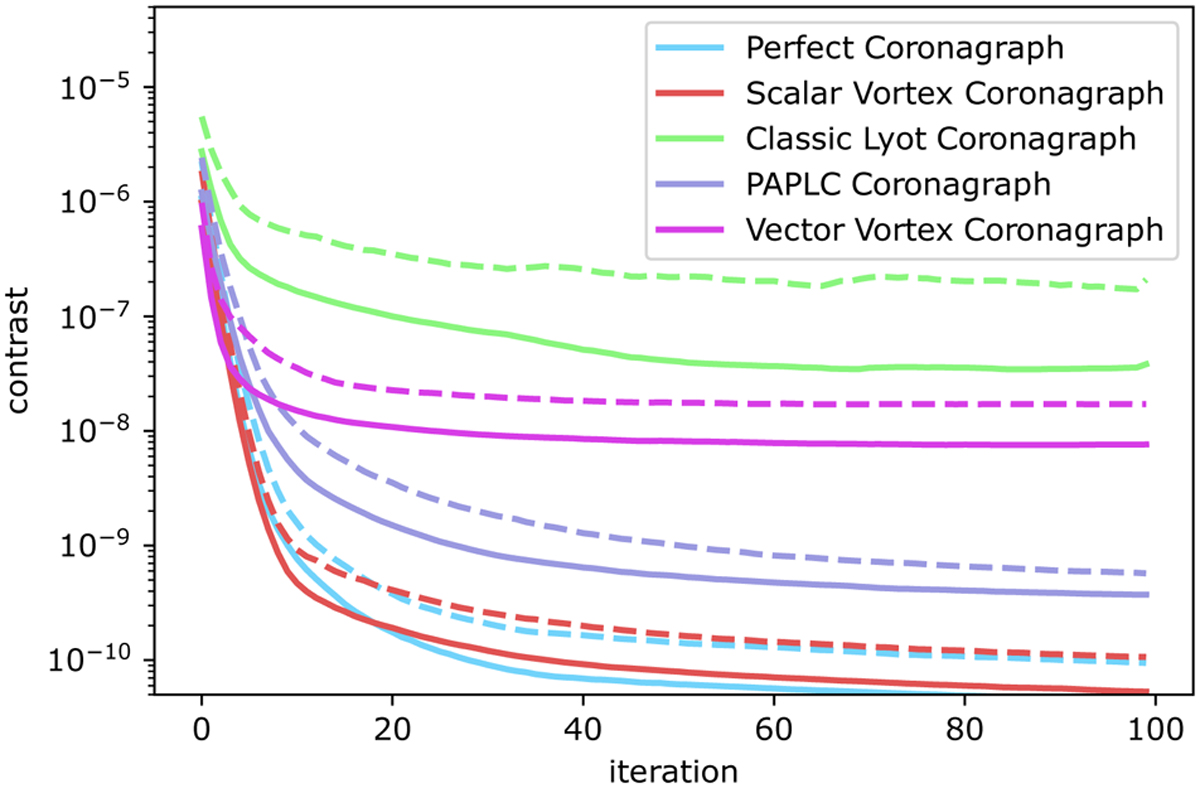
Contrast as a function of iteration. Each color represents a different coronagraph. The solid lines shows the median contrast within the dark hole. The dashed lines correspond to the 84th quantile, which is the 1σ upper confidence bound. The Perfect, Vortex and PAPLC coronagraphs rapidly reach a contrast of 10−9 and then slowly converge to 10−10. The Classic Lyot and the Vector Vortex Corongraph converge to ~10−8. The iEFC controller is also stable because even after 100 iterations the contrast does not diverge.
Current usage metrics show cumulative count of Article Views (full-text article views including HTML views, PDF and ePub downloads, according to the available data) and Abstracts Views on Vision4Press platform.
Data correspond to usage on the plateform after 2015. The current usage metrics is available 48-96 hours after online publication and is updated daily on week days.
Initial download of the metrics may take a while.