Fig. 9
Download original image
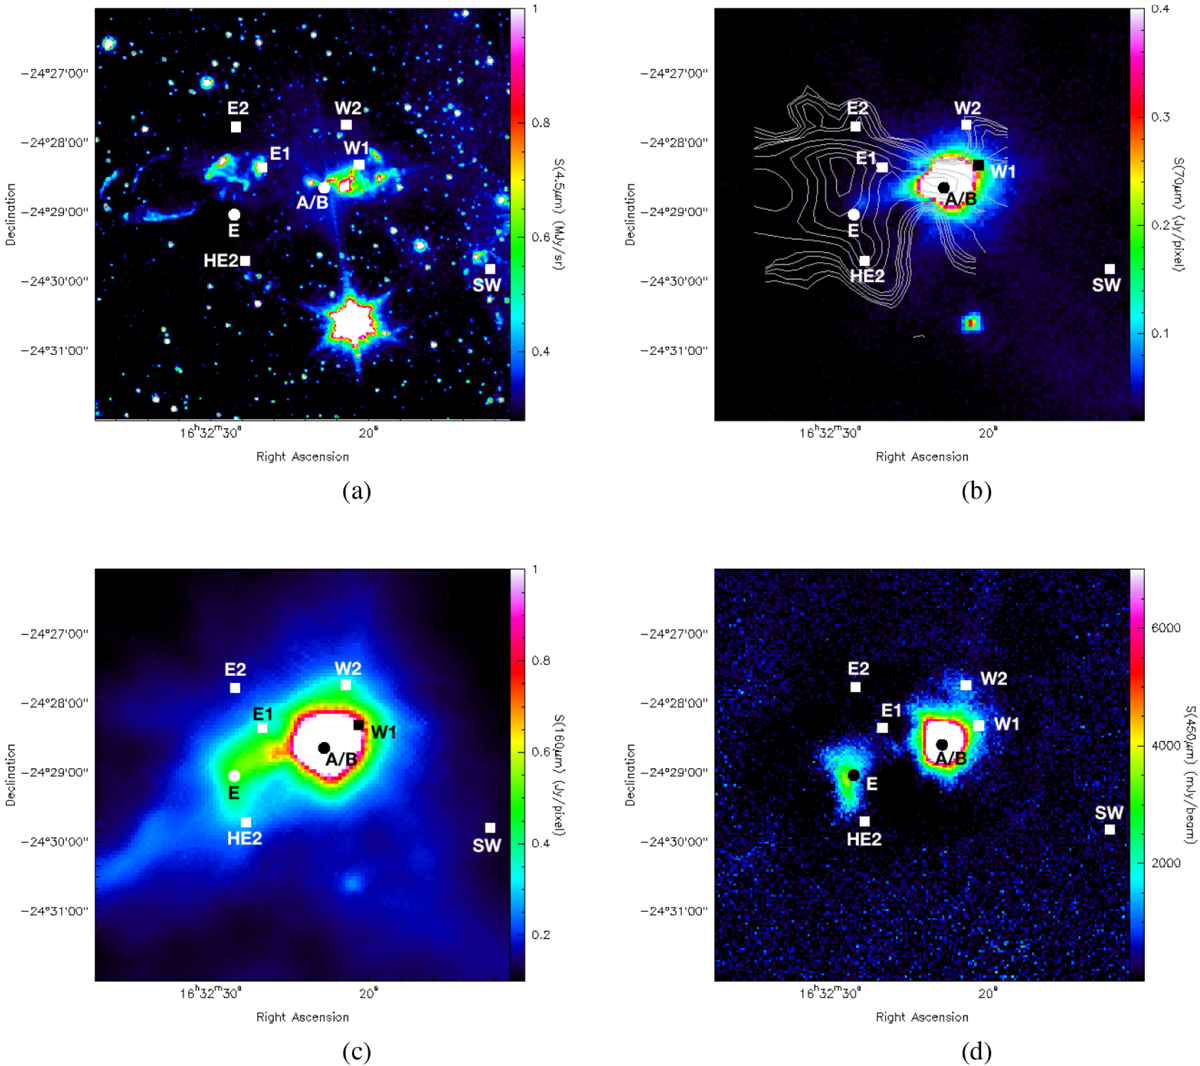
Continuum maps of the L1689N region at different wavelengths. (a) Spitzer IRAC2 map at 4.5 μm. (b) Herschel PACS map at 70 μm. The white contours in this panel indicate the integrated CO (3−2) intensity between −27.0 km s−1 and 3.6 km s−1 at 1.6K km s−1, 5.3 K km s−1, 13.2 K km s−1, 26.4 K km s−1 and 39.6 K km s−1 levels. (c) Herschel PACS map at 160 μm. (d) JCMT SCUBA-2 map at 450 μm. The markers show positions discussed in the previous sections.
Current usage metrics show cumulative count of Article Views (full-text article views including HTML views, PDF and ePub downloads, according to the available data) and Abstracts Views on Vision4Press platform.
Data correspond to usage on the plateform after 2015. The current usage metrics is available 48-96 hours after online publication and is updated daily on week days.
Initial download of the metrics may take a while.