Open Access
Fig. J.61
Download original image
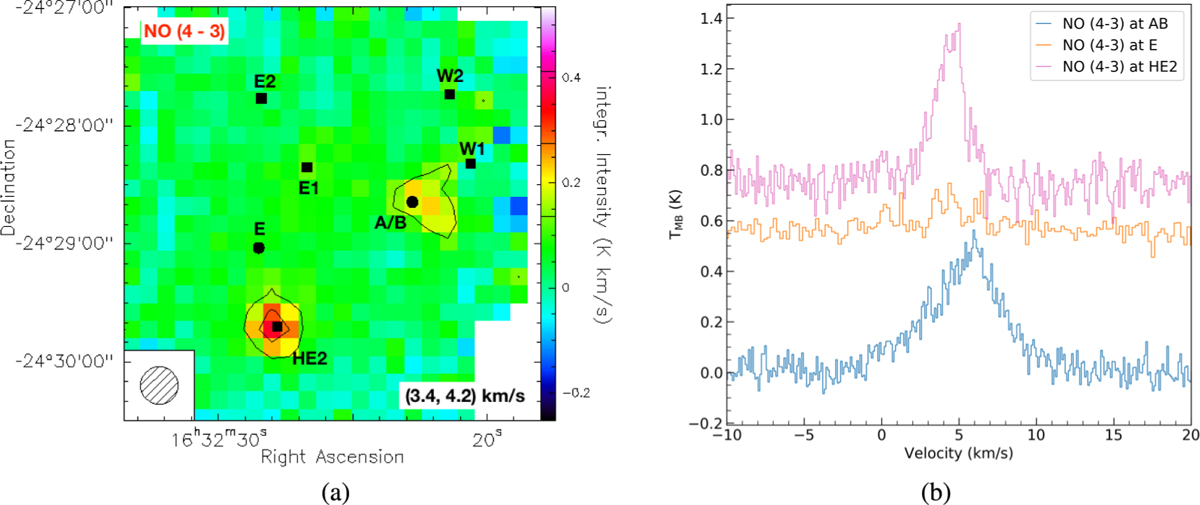
(a) NO (4−,7/2,7/2−3+,5/2,5/2) transition at 350690.766 MHz. Additional contours are drawn at 1σ and 2σ. (b) Averaged spectrum of this transition in a 10" radius at the positions indicated in the upper right corner. The NO line is blended with a CH3OH-E transition at 350787.662 MHz and a NO transition at 350689.494 MHz.
Current usage metrics show cumulative count of Article Views (full-text article views including HTML views, PDF and ePub downloads, according to the available data) and Abstracts Views on Vision4Press platform.
Data correspond to usage on the plateform after 2015. The current usage metrics is available 48-96 hours after online publication and is updated daily on week days.
Initial download of the metrics may take a while.