Open Access
Fig. J.17
Download original image
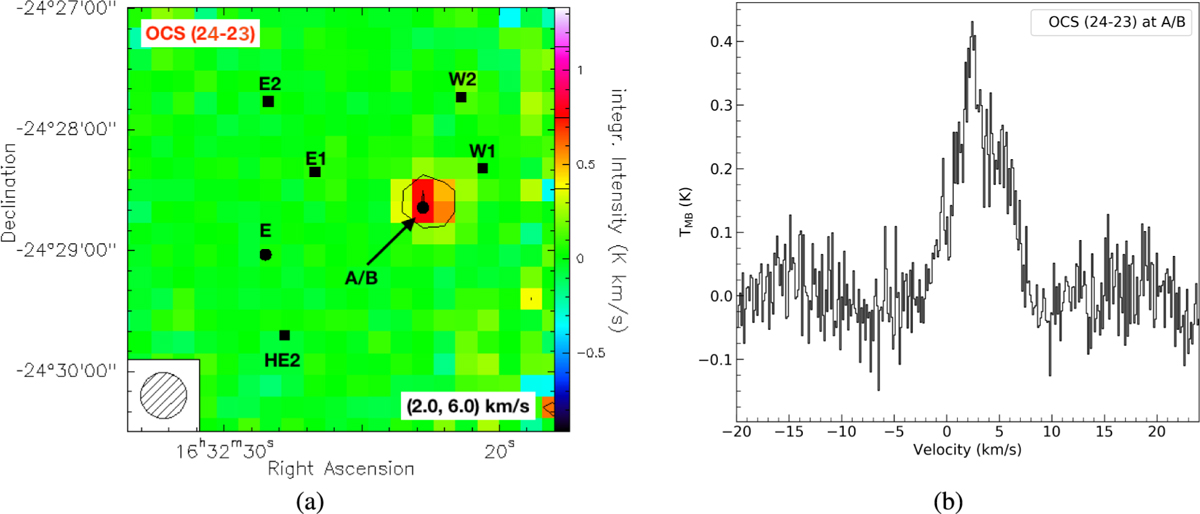
(a) OCS (24−23) transition at 291839.653 MHz. Additional contours are drawn at 1σ and 2σ. (b) Averaged spectrum of this transition in a 10" radius at the position of IRAS 16293 A/B.
Current usage metrics show cumulative count of Article Views (full-text article views including HTML views, PDF and ePub downloads, according to the available data) and Abstracts Views on Vision4Press platform.
Data correspond to usage on the plateform after 2015. The current usage metrics is available 48-96 hours after online publication and is updated daily on week days.
Initial download of the metrics may take a while.