Open Access
Fig. I.2
Download original image
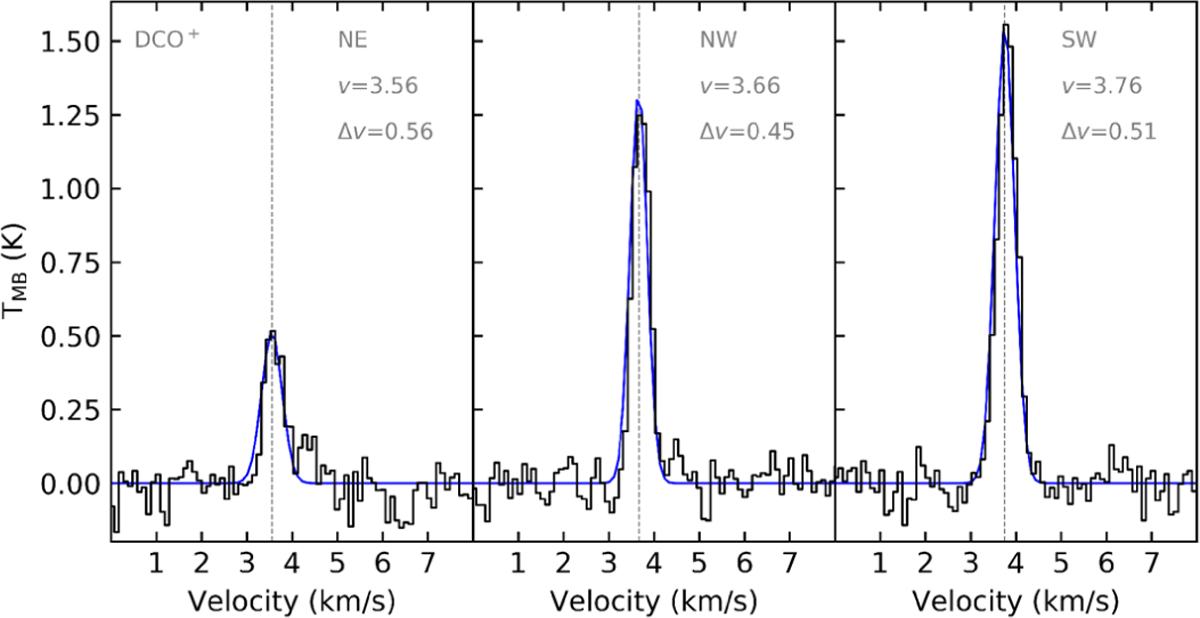
Line profiles of the DCO+ (360169.778 MHz) transition in the vicinity of 16293E. The data is displayed in black while the blue line shows the computed Gaussian fits to the spectra. Gray vertical lines mark the position of the fit Gaussians.
Current usage metrics show cumulative count of Article Views (full-text article views including HTML views, PDF and ePub downloads, according to the available data) and Abstracts Views on Vision4Press platform.
Data correspond to usage on the plateform after 2015. The current usage metrics is available 48-96 hours after online publication and is updated daily on week days.
Initial download of the metrics may take a while.