Fig. 11
Download original image
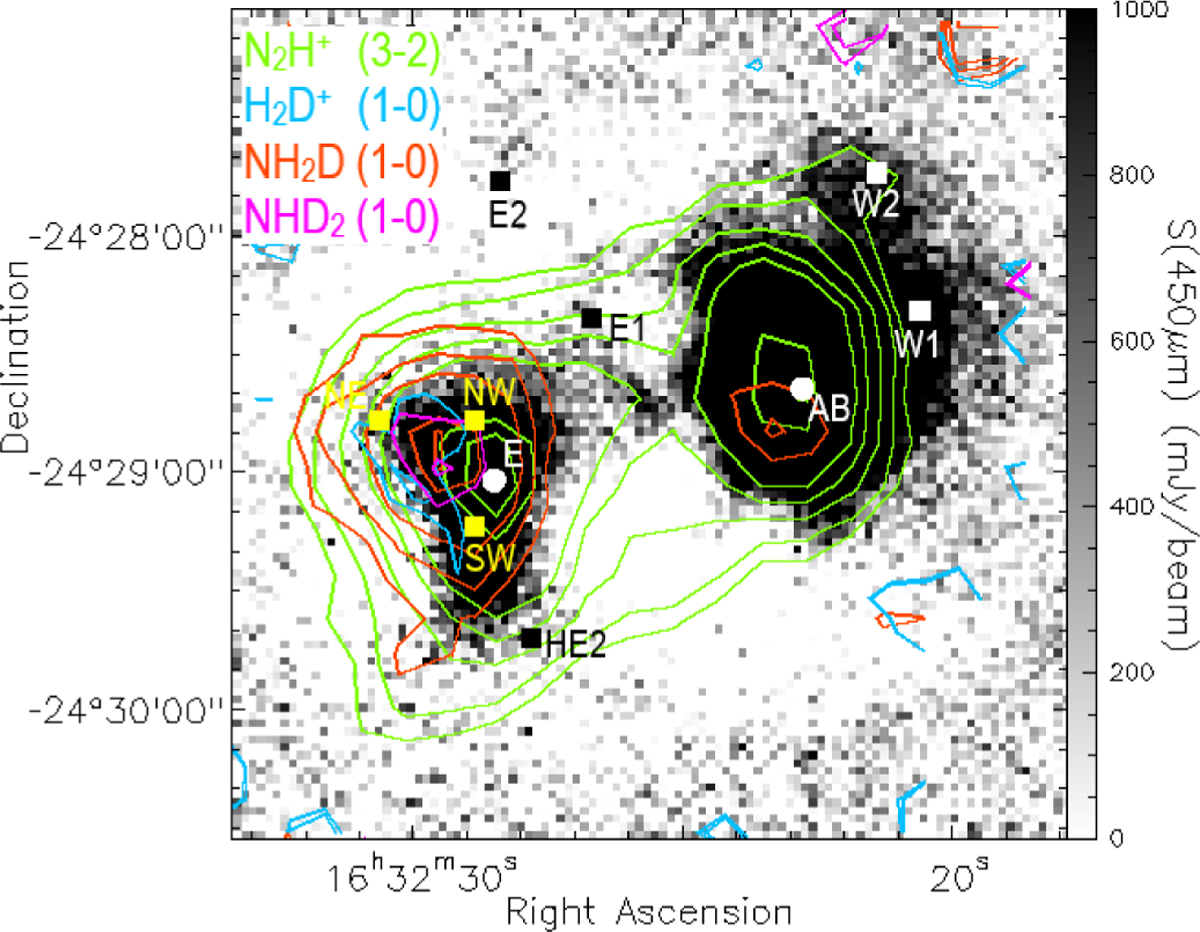
Continuum JCMT SCUBA-2 image at 450 μm (grayscale), overlaid with the emission of NH2D (1−0) (red), NHD2 (magenta), H2D+ (1−0) (blue), and N2H+ (3−2) (green). Contours of N2H+ are the same as in Fig. 10, while contours of NH2D, NHD2, and H2D+ are drawn at (1σ, 1.5σ, 2σ, 3σ, 3.3σ), (1σ, 1.1σ), and (1σ, 1.2σ) respectively. The three yellow squares mark the positions of the extracted spectra for the analysis in Sect. 5.3.2.
Current usage metrics show cumulative count of Article Views (full-text article views including HTML views, PDF and ePub downloads, according to the available data) and Abstracts Views on Vision4Press platform.
Data correspond to usage on the plateform after 2015. The current usage metrics is available 48-96 hours after online publication and is updated daily on week days.
Initial download of the metrics may take a while.