Fig. 4
Download original image
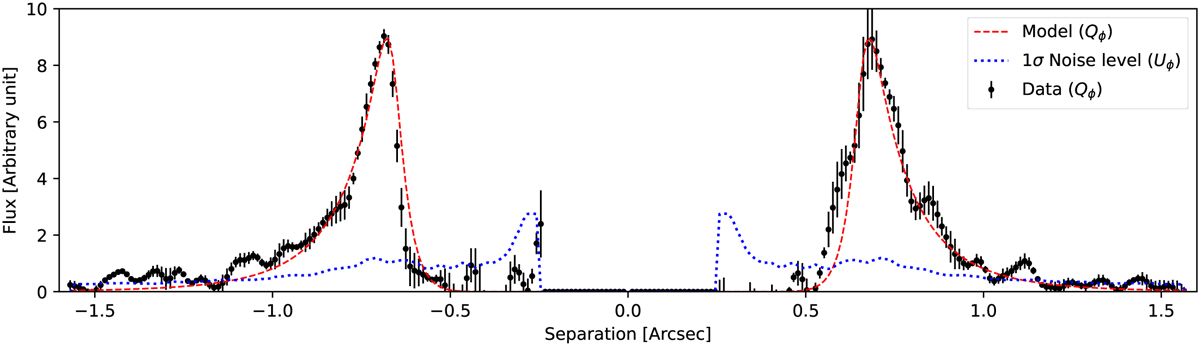
Radial profile of Qϕ following the projected major axis (6 pixels wide) from the southwest to the northeast of the disk is shows with a black points and with the corresponding error bars. The radial profile of the best model is shown with a red dashed line, and the noise level obtained with the azimuthal standard deviation of the Uϕ image is shown with a blue dotted line.
Current usage metrics show cumulative count of Article Views (full-text article views including HTML views, PDF and ePub downloads, according to the available data) and Abstracts Views on Vision4Press platform.
Data correspond to usage on the plateform after 2015. The current usage metrics is available 48-96 hours after online publication and is updated daily on week days.
Initial download of the metrics may take a while.