Fig. 8
Download original image
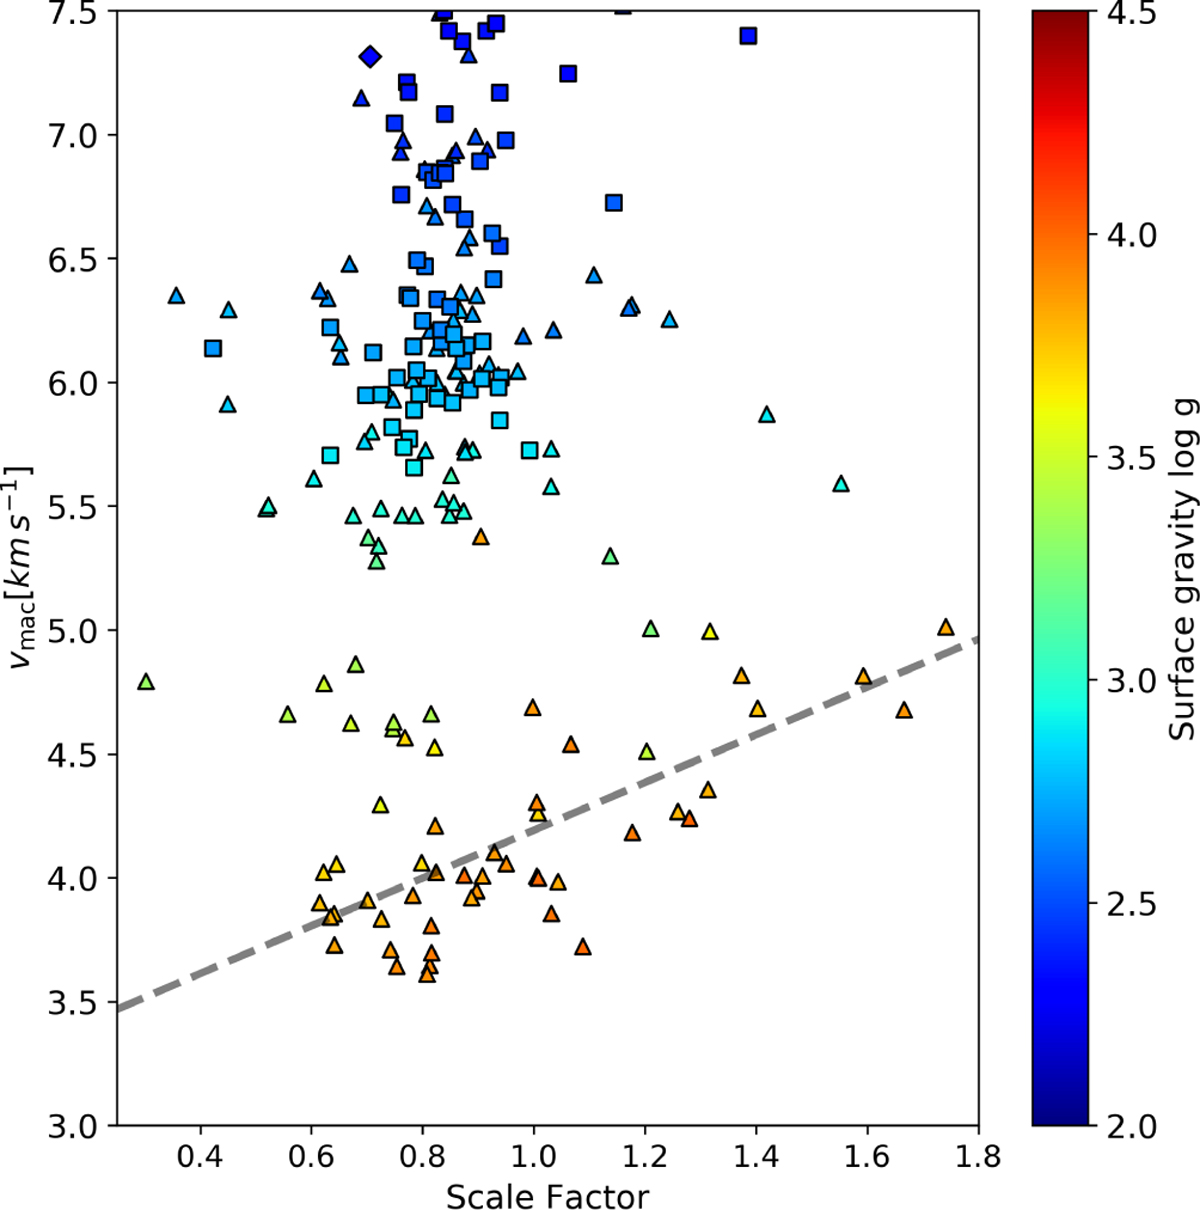
Comparison of macroturbulence dispersion, determined from the Doyle et al. (2014) fit, and our HARPS pMS scale factors. The gray, dashed line shows a linear fit to the subgiants with log g < 3.6. Markers are colored for surface gravity (based on MIST fits). The marker shapes correspond to the evolutionary phases according to MIST: sub- or red giant (triangle), core Helium burning (squares), and asymptotic giant (diamonds).
Current usage metrics show cumulative count of Article Views (full-text article views including HTML views, PDF and ePub downloads, according to the available data) and Abstracts Views on Vision4Press platform.
Data correspond to usage on the plateform after 2015. The current usage metrics is available 48-96 hours after online publication and is updated daily on week days.
Initial download of the metrics may take a while.