Fig. 7
Download original image
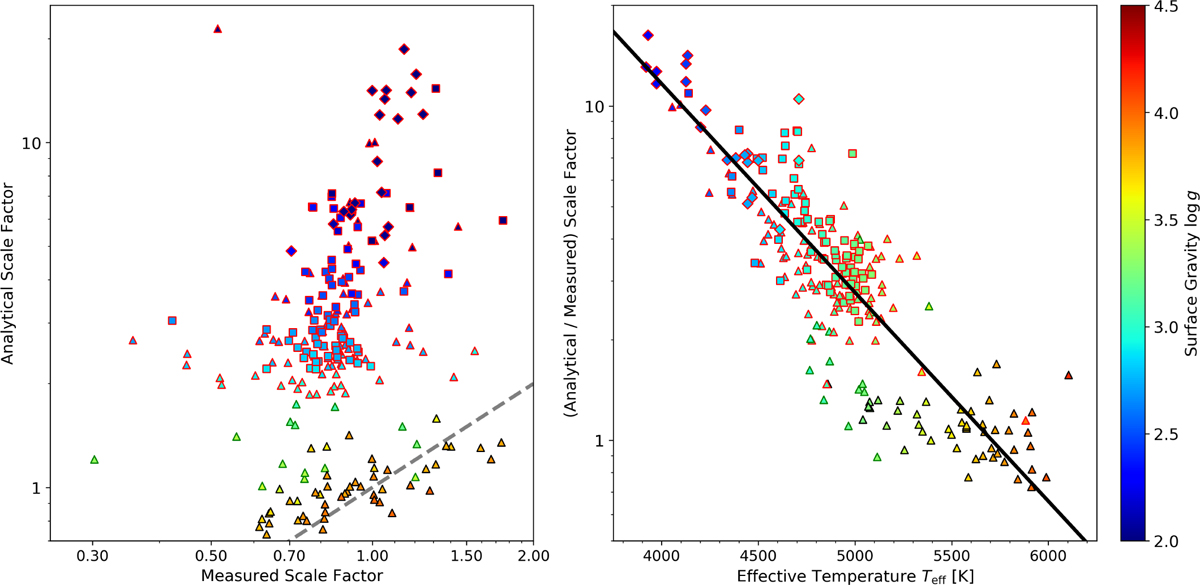
Comparison of analytical and empirical scale factors. Left: Scale factors measured from the HARPS post-MS sample plotted against values expected from the Basu & Chaplin (2017) analytical relations. The gray, dashed line shows equality. Right: Ratio of scale factor values expected from the Basu & Chaplin (2017) analytical relations (Eq. (5)) and measured from the HARPS post-MS sample. The black line was fitted as a correction factor to the analytic values as a function of effective temperature. Both: Markers are colored for surface gravity (based on MIST fits). Black edges indicate log g > 3.5, green 3.5 > log g > 3.0, and red 3.0 > log g. The marker shapes correspond to the evolutionary phases according to MIST: sub- or red giant (triangle), core Helium burning (squares), and asymptotic giant (diamonds).
Current usage metrics show cumulative count of Article Views (full-text article views including HTML views, PDF and ePub downloads, according to the available data) and Abstracts Views on Vision4Press platform.
Data correspond to usage on the plateform after 2015. The current usage metrics is available 48-96 hours after online publication and is updated daily on week days.
Initial download of the metrics may take a while.