Fig. 6
Download original image
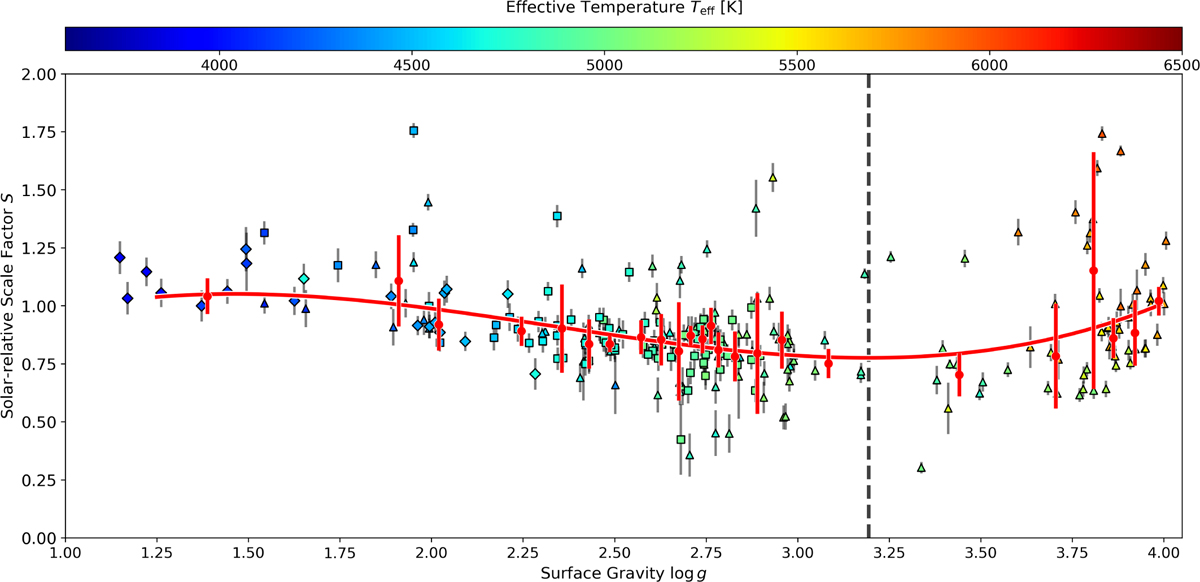
Scale factor vs. surface gravity (based on MIST fits) for the post-MS stars of the HARPS sample. The relation SHARPS,pMS (log g) for the post-MS stars is fitted with a cubic polynomial (red line). The effective temperature for each star is color coded. The marker shapes correspond to the evolutionary phases according to MIST: sub- or red giant (triangle), core Helium burning (squares), and asymptotic giant (diamonds). A local minimum in scale factor at log g ≈ 3.2 is marked (gray, dashed line).
Current usage metrics show cumulative count of Article Views (full-text article views including HTML views, PDF and ePub downloads, according to the available data) and Abstracts Views on Vision4Press platform.
Data correspond to usage on the plateform after 2015. The current usage metrics is available 48-96 hours after online publication and is updated daily on week days.
Initial download of the metrics may take a while.