Fig. 4
Download original image
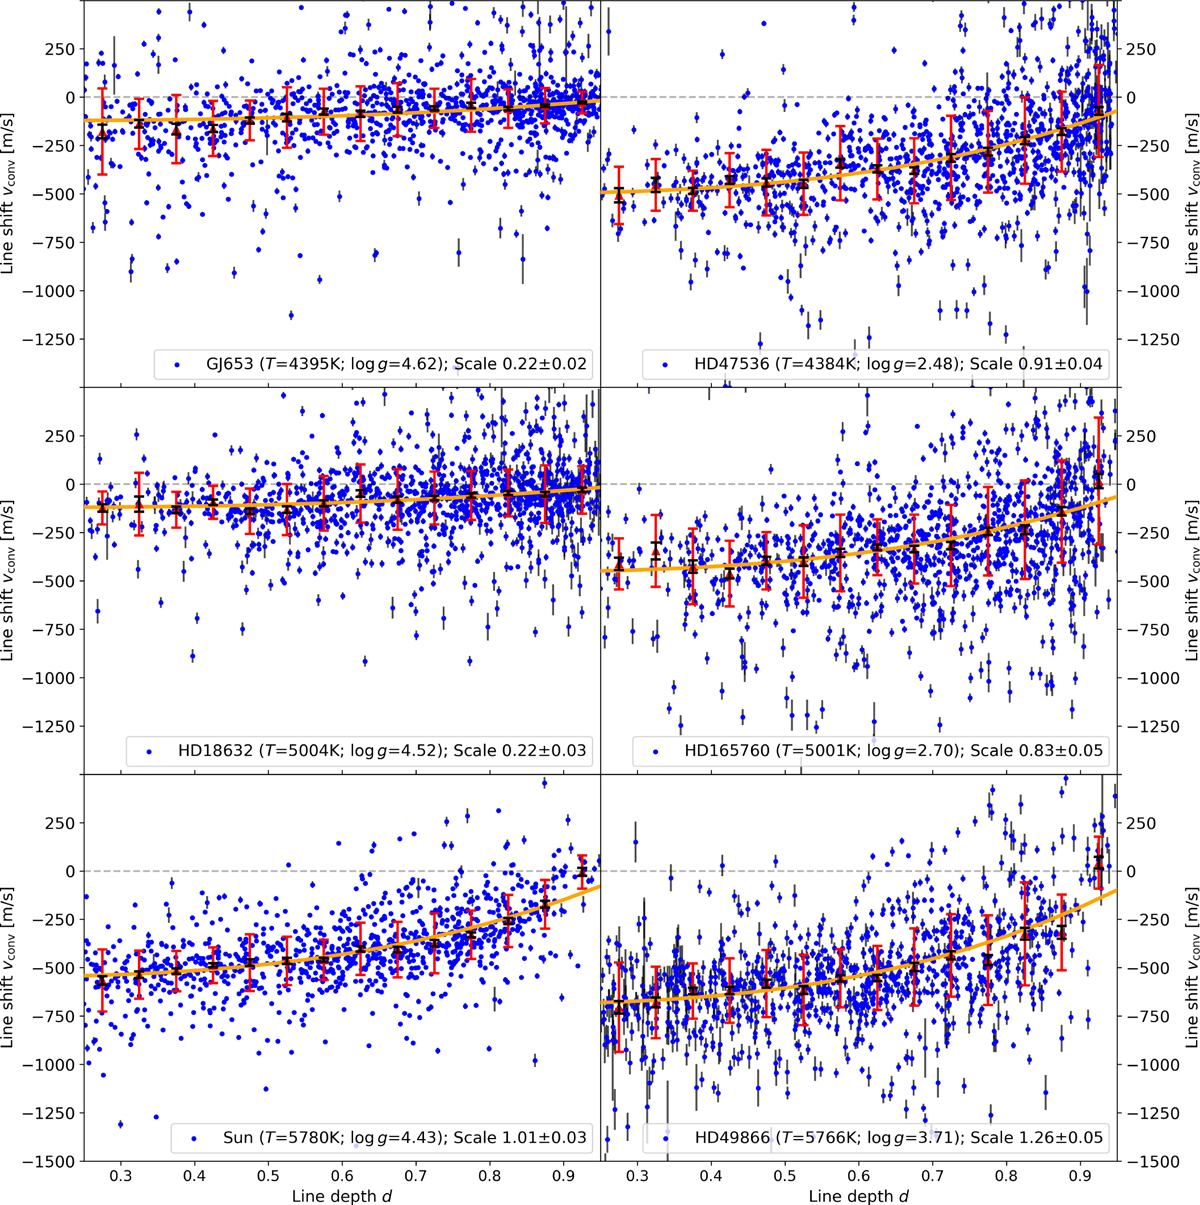
Comparison of the convective blueshift of selected MS (left) and post-MS (right) stars of similar effective temperatures (rows) from the HARPS samples. The more advanced evolutionary stage can be inferred from the significantly decreased surface gravity log g for the stars on the right. Marked are individual spectral line measurements from the VALD list (blue points with errorbars), bin medians (red triangles, the red bars indicate the median absolute deviation), error of the bin median (black errorbars, analogous to the error of the mean), and the fitted third signature (orange line, scale factor in legend).
Current usage metrics show cumulative count of Article Views (full-text article views including HTML views, PDF and ePub downloads, according to the available data) and Abstracts Views on Vision4Press platform.
Data correspond to usage on the plateform after 2015. The current usage metrics is available 48-96 hours after online publication and is updated daily on week days.
Initial download of the metrics may take a while.