Fig. 3
Download original image
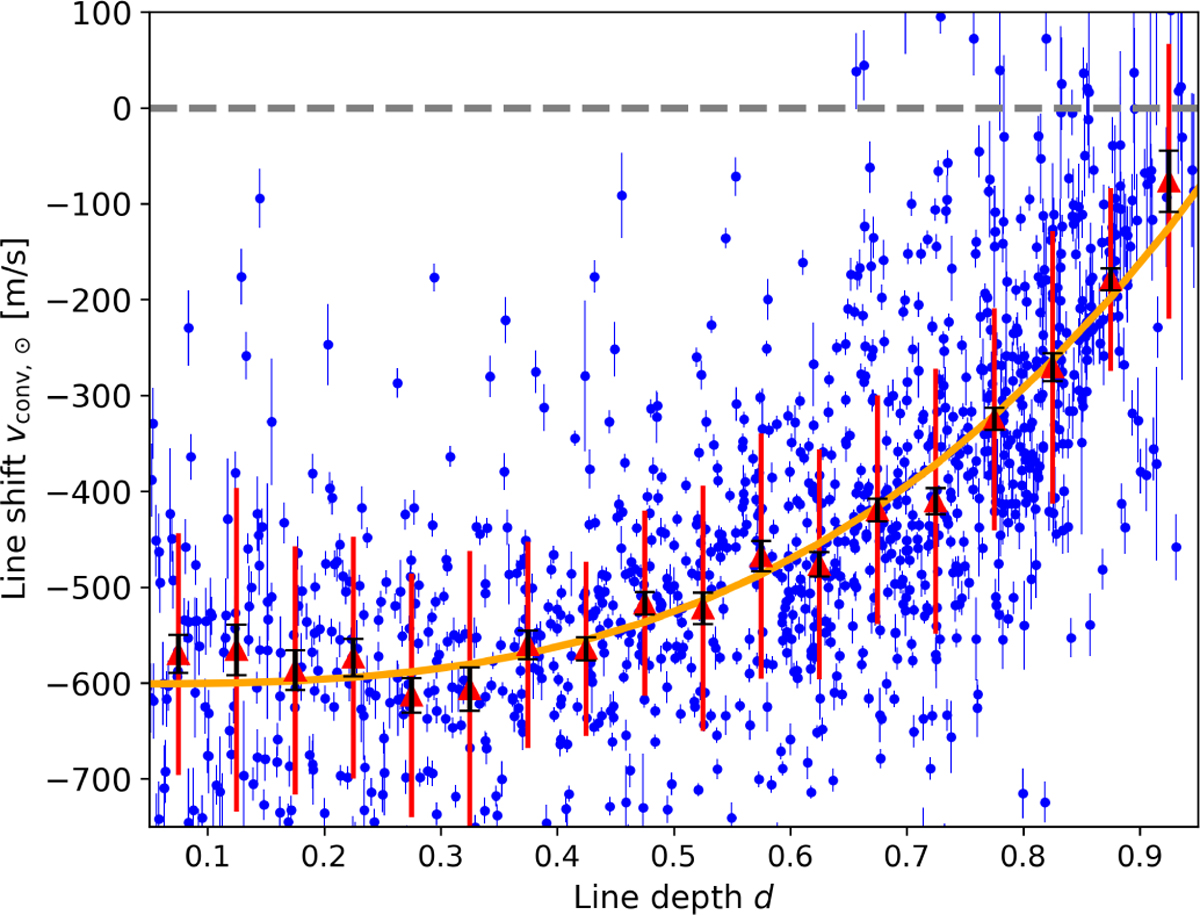
Line shift vs. line depth for the solar template spectrum and the third signature of granulation template used in this work. This plot is modified from Paper I, Fig. 5, center-left panel, with adjusted axes but using the same data, binning, and fitted signature. Marked are the 1168 individual spectral line measurements from the VALD list (blue points with errorbars), 18 bin medians (red triangles, the red bars indicate the median absolute deviation), error of the bin median (black errorbars, analogous to the error of the mean), and the template third signature (orange line, Eq. (1)).
Current usage metrics show cumulative count of Article Views (full-text article views including HTML views, PDF and ePub downloads, according to the available data) and Abstracts Views on Vision4Press platform.
Data correspond to usage on the plateform after 2015. The current usage metrics is available 48-96 hours after online publication and is updated daily on week days.
Initial download of the metrics may take a while.