Fig. 2
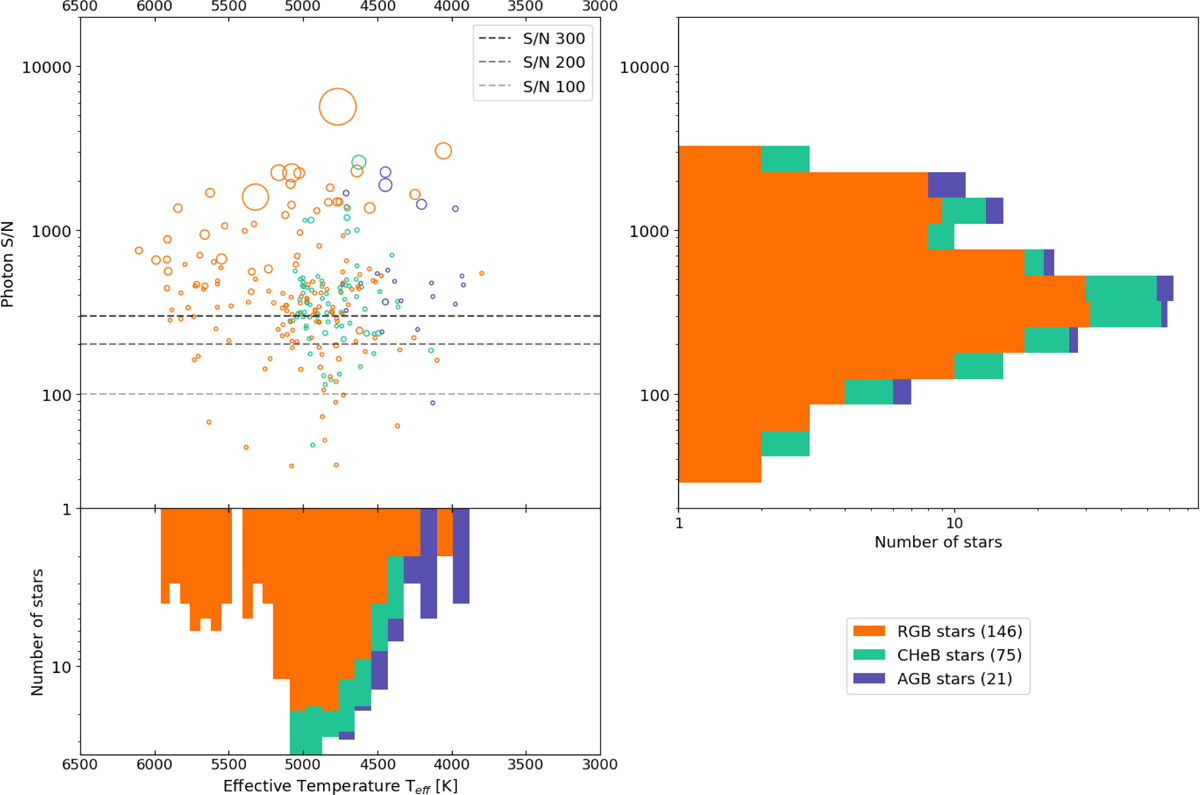
Download original image
Overview of all final sample stars' signal-to-noise ratio (S/N) from serval, temperature from Gaia DR2, and evolutionary phase according to MIST photometry (color coded; the legend shows the number of stars per phase). Top left: Distribution of S/N over temperature within the sample. The circle size corresponds to the number of observations for that star. The dashed, horizontal lines mark S/N values of 100, 200, and 300. Top right: S/N for the coadded spectra in the sample. Bottom left: Distribution of temperatures within the sample.
Current usage metrics show cumulative count of Article Views (full-text article views including HTML views, PDF and ePub downloads, according to the available data) and Abstracts Views on Vision4Press platform.
Data correspond to usage on the plateform after 2015. The current usage metrics is available 48-96 hours after online publication and is updated daily on week days.
Initial download of the metrics may take a while.