Fig. 6
Download original image
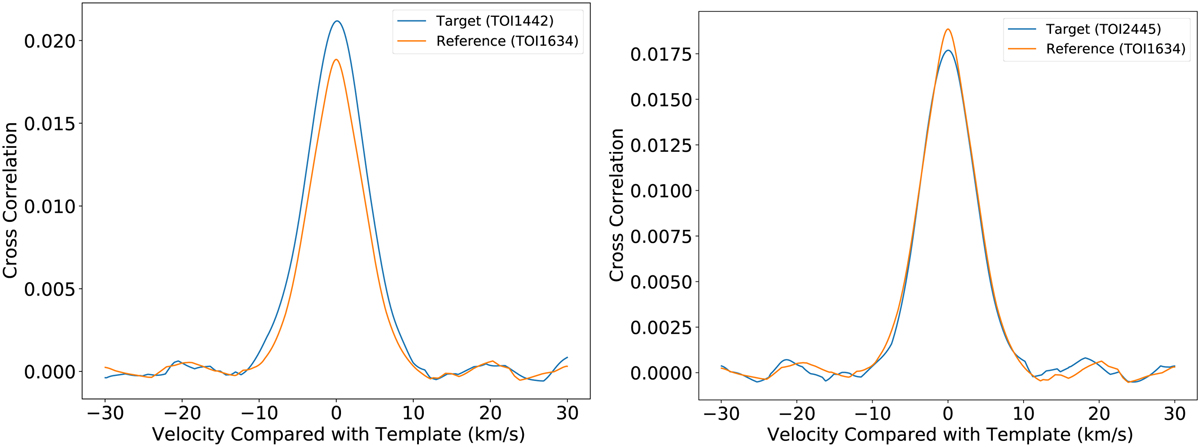
Examples of CCFs. Left panel: calculated CCF of the IRD spectrum of TOI-1442 (blue) taken on UT 2021 June 25 at the orbital phase 0.33, to the template spectrum of TOI-1634, exhibiting a single peak with width of ~10 km s−1. The autocorrelation function of the TOI-1634 spectrum is overplotted as a reference. Right panel: analogous plot with the CCF of the IRD spectrum of TOI-2445 (blue) taken on UT 2021 October 27 at the orbital phase 0.75.
Current usage metrics show cumulative count of Article Views (full-text article views including HTML views, PDF and ePub downloads, according to the available data) and Abstracts Views on Vision4Press platform.
Data correspond to usage on the plateform after 2015. The current usage metrics is available 48-96 hours after online publication and is updated daily on week days.
Initial download of the metrics may take a while.