Fig. 4
Download original image
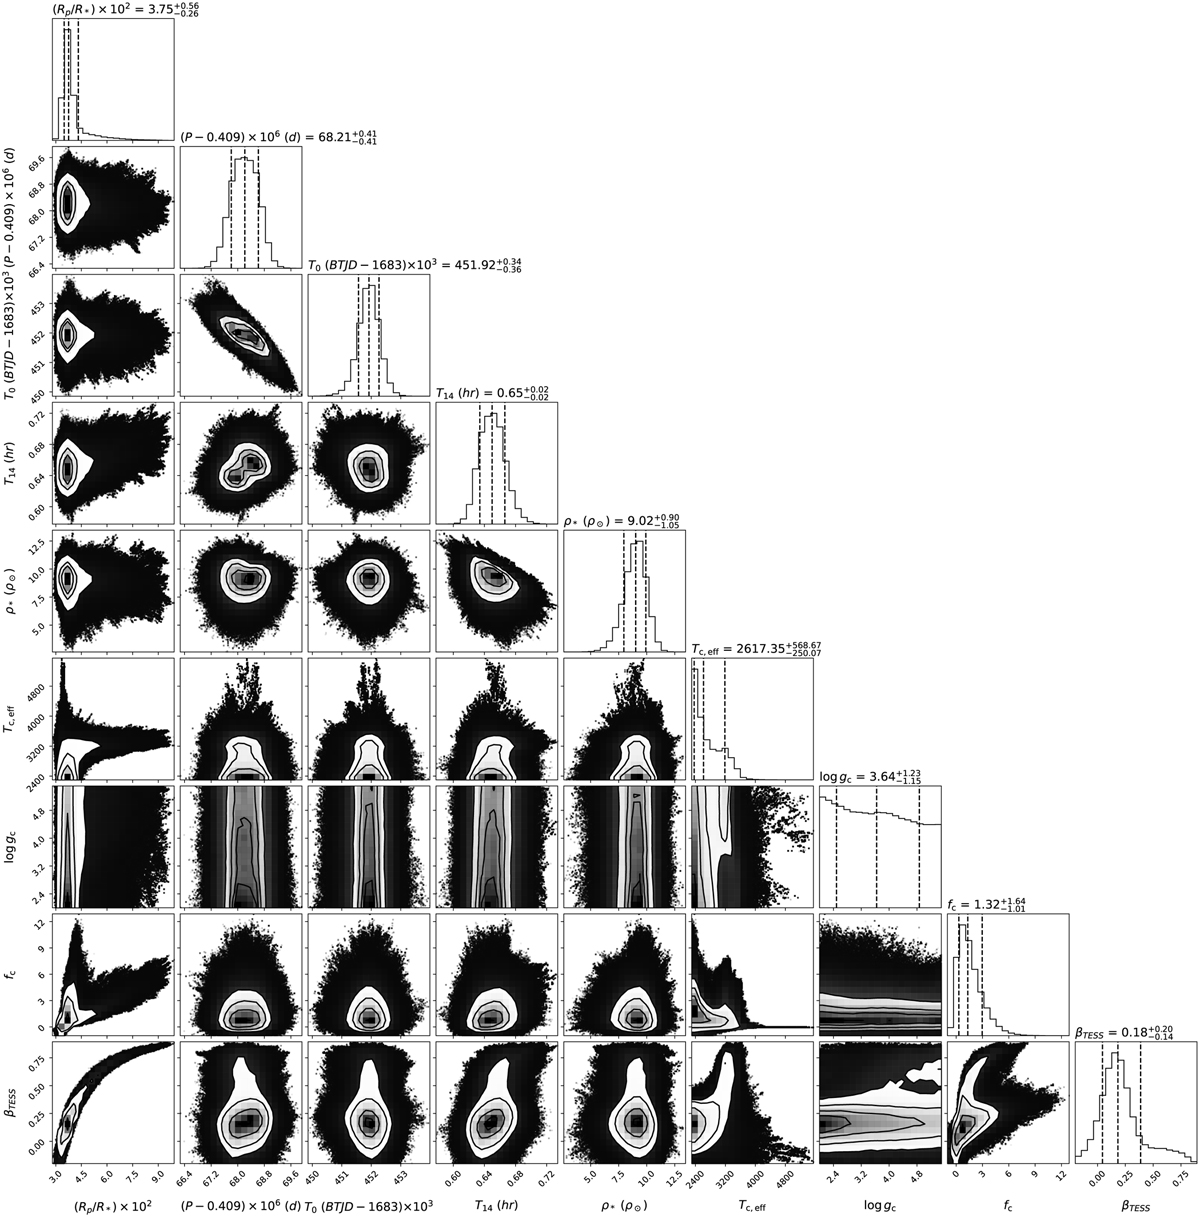
Cornerplot showing the posterior distributions and mutual correlations of the transit model parameters for TOI-1442. The histograms along the diagonal give the median value 1σ error bars (absolute differences between the medians and the 16th and 84th quantiles) of the distributions. This plot was generated by using the corner Python package (Foreman-Mackey 2016).
Current usage metrics show cumulative count of Article Views (full-text article views including HTML views, PDF and ePub downloads, according to the available data) and Abstracts Views on Vision4Press platform.
Data correspond to usage on the plateform after 2015. The current usage metrics is available 48-96 hours after online publication and is updated daily on week days.
Initial download of the metrics may take a while.