Fig. 1
Download original image
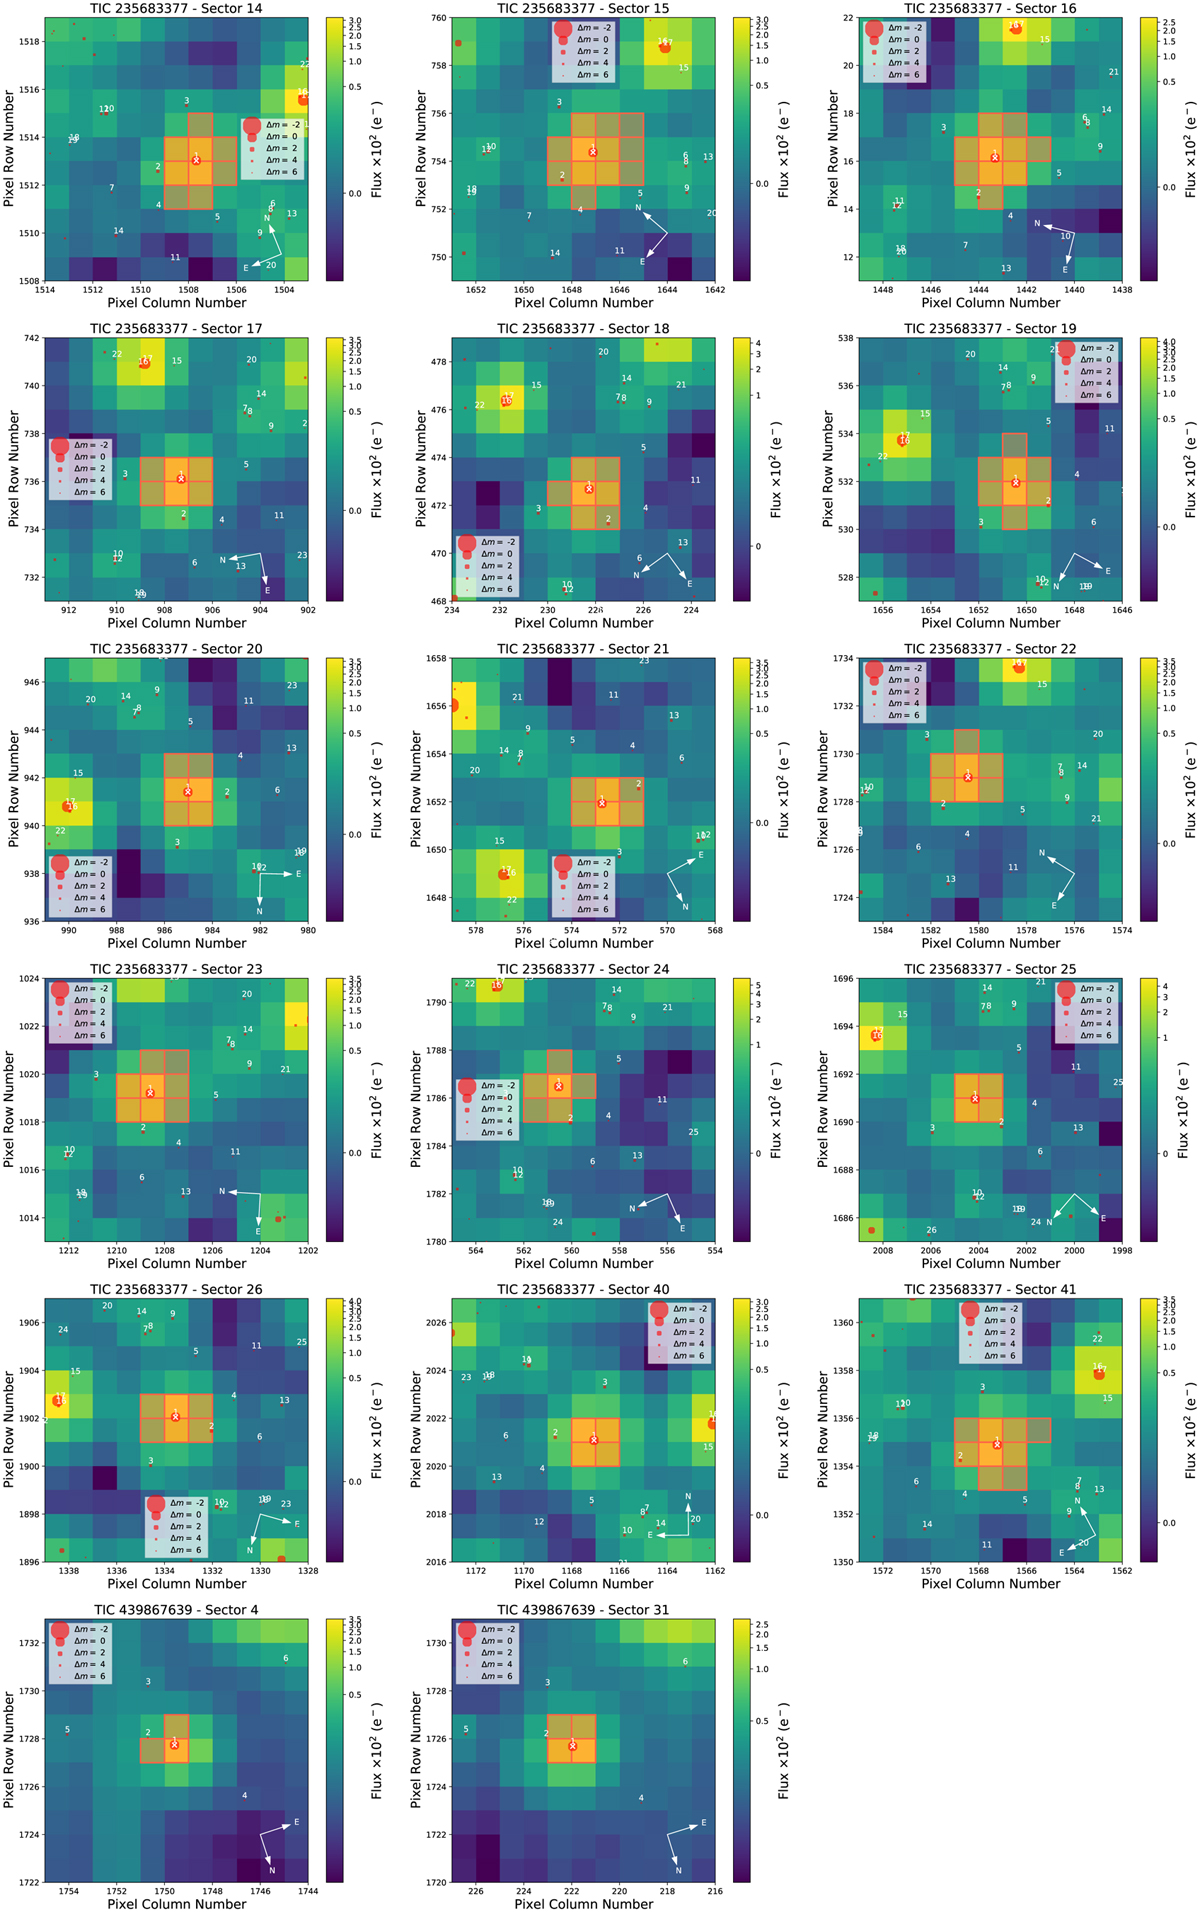
TESS target pixel file images of TOI-1442 (top 15 panels) and TOI-2445 (last 2 panels). The pixels highlighted in red denote the aperture mask used to calculate the SAP. The red circles represent neighbouring sources listed in Gaia DR2; the target star is shown with a white ‘x’ and identifier 1. The size of the red circles is inversely proportional to the apparent magnitude difference with respect to the target star. The maximum contrast magnitude of the plotted sources is Δm = 6 mag.
Current usage metrics show cumulative count of Article Views (full-text article views including HTML views, PDF and ePub downloads, according to the available data) and Abstracts Views on Vision4Press platform.
Data correspond to usage on the plateform after 2015. The current usage metrics is available 48-96 hours after online publication and is updated daily on week days.
Initial download of the metrics may take a while.