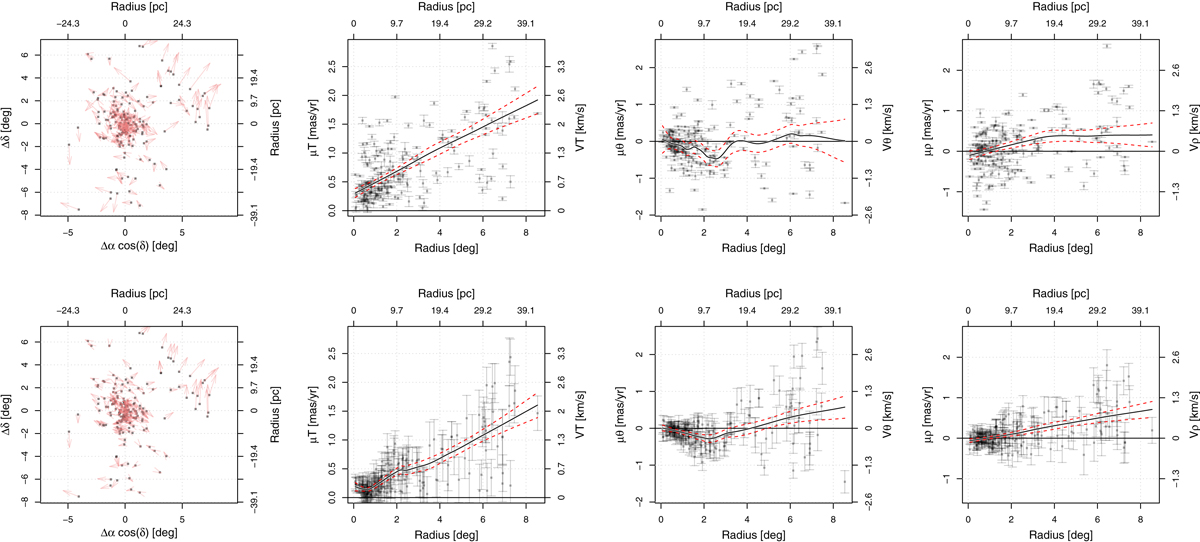
Fig. C.1.
Download original image
Spatio-kinematic diagrams for Alessi 3. The real data from Gaia EDR3 is plotted in the first row. The second row shows the result of our method. In the first column, we represent the star positions and their proper motion vectors. In the second column we show the total proper motion in function of the radius to the cluster’s centre. The third and fourth columns show a polar decomposition of the proper motion field. In the third column we show the component in the angular direction in function of the distance to the cluster centre, which indicates the rotational component of the proper motion: it is positive for anticlockwise rotations and negative for clockwise ones. In the fourth column, we show the radial component in function of the distance to the cluster centre, which can indicate if the cluster is contracting if it is negative, or expanding if it is positive.
Current usage metrics show cumulative count of Article Views (full-text article views including HTML views, PDF and ePub downloads, according to the available data) and Abstracts Views on Vision4Press platform.
Data correspond to usage on the plateform after 2015. The current usage metrics is available 48-96 hours after online publication and is updated daily on week days.
Initial download of the metrics may take a while.