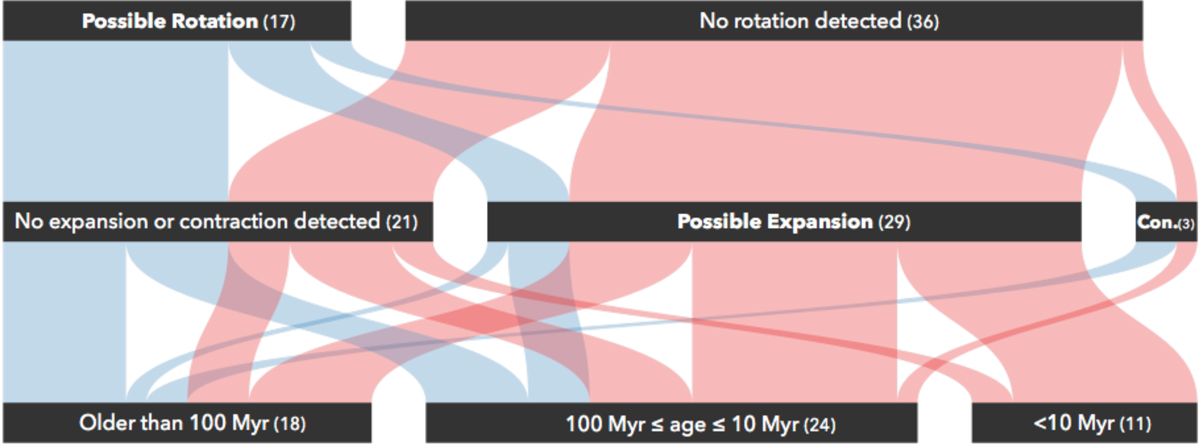
Fig. 4.
Download original image
Correlations between cluster ages and two different classes of kinematic patterns: rotation and no-rotation as well as expansion, contraction, and others (represented as ‘no expansion or contraction detected’) for the sample where some pattern could be detected in this work. The numbers in each box indicate the total number of objects for which the patterns were detected in this sample. The blue bands represent clusters with possible rotation patterns while the red bands the clusters where no rotation was detected. The bands are proportional to the number of clusters with each pattern (e.g. about half of the clusters older than 100 Myr had a detectable rotation in this sample), and they connect the different dimensions, revealing correlations in the patterns of the sample among the different dimensions (e.g. most clusters where a possible rotation and a possible expansion were detected have ages between 10 and 100 Myr).
Current usage metrics show cumulative count of Article Views (full-text article views including HTML views, PDF and ePub downloads, according to the available data) and Abstracts Views on Vision4Press platform.
Data correspond to usage on the plateform after 2015. The current usage metrics is available 48-96 hours after online publication and is updated daily on week days.
Initial download of the metrics may take a while.